- Joined
- 20 July 2021
- Posts
- 12,728
- Reactions
- 17,692
i see WHC is up nicely .. is everyone getting lumps of coal for Xmas ??
( i hold WHC 'free-carried' )
( i hold WHC 'free-carried' )
No, I'm holding the slow one, YALi see WHC is up nicely .. is everyone getting lumps of coal for Xmas ??
( i hold WHC 'free-carried' )
Good for bbozI agree that a pause and dip is natural after such a strong rally. The selling today with no significant news was unexpected after a modest start. The depth of this pull-back will be interesting. I'm slightly bearish as I don't see any reasons for our market to continue higher. I've still got a "buy the dip" outlook so I'm waiting for the dip to pause first.
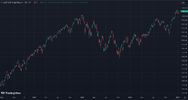
Speculating here and technical analysis isn't really my investing focus but if I look at a chart of the S&P 500 and stand back then what do I see? Looking at a weekly chart:The selling today with no significant news was unexpected after a modest start. The depth of this pull-back will be interesting. I'm slightly bearish as I don't see any reasons for our market to continue higher.

Not especially bullish that for sure but the fall today allowed me to complete my first bunch of super long term stocks.Speculating here and technical analysis isn't really my investing focus but if I look at a chart of the S&P 500 and stand back then what do I see? Looking at a weekly chart:
I see an almost uninterrupted rise from the March 2020 low to a high on 31 December 2021.
Then the market came almost half way back down, with the low in mid-October 2022.
Then trended back up with the latest high being on 29 December 2023 at almost exactly the same level as two years prior followed by an immediate pullback.
A major double top? Two highs, both right at the end of the calendar year, with a low roughly half way in the middle chronologically has me a bit suspicious as to what's going on.....
I wouldn't be having so many bear thoughts if not for the fundamental backdrop of an extended inverted yield curve, the Fed shrinking its balance sheet and so on but if I look at that backdrop, then I look at the chart, well bearish thoughts to occur.....
That's for the S&P500 but there's a reasonable correlation with the ASX usually.
Then trended back up with the latest high being on 29 December 2023 at almost exactly the same level as two years prior followed by an immediate pullback.
I wouldn't be having so many bear thoughts if not for the fundamental backdrop of an extended inverted yield curve, the Fed shrinking its balance sheet and so on but if I look at that backdrop, then I look at the chart, well bearish thoughts to occur.....
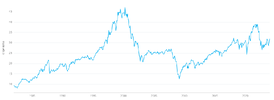
That's for the S&P500 but there's a reasonable correlation with the ASX usually.

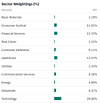
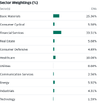
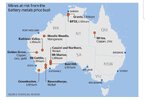
bit of a rout happening . .. cyclical or what?I'm staying out of the Aussie resource sector other than gold, iron ore and uranium. Battery minerals are on the nose as prices continue to fall. Billions will be written off soon as mines won't be developed (CHN, RTR, RXM, CXO, LTR). Mines being put into care & maintenance (BHP, IGO, MIN). This may take years to resolve.
Indonesia has wrecked the Aussie nickel miners seemingly oblivious to the destruction of their own country.
XMJ - resource is down 9% from its recent high. QRE - materials ETF is down 10%.
ACDC - lithium ETF is 24% off its high.
Where's an inverse resource/material ETF when we need one?
bit of a rout happening . .. cyclical or what?
So far it has only taken back what it gave yesterday...good effort holding on
Hello and welcome to Aussie Stock Forums!
To gain full access you must register. Registration is free and takes only a few seconds to complete.
Already a member? Log in here.