- Joined
- 31 March 2015
- Posts
- 477
- Reactions
- 865
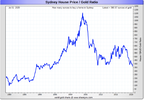
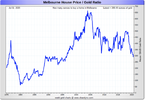
With regard to the housing market the EW chart I posted some days ago suggests this drive up is a 5th and last wave and the move down in IR is and an ending diagonal. These patterns are not set in stone, 5th waves can extend. But it's a warning sign that we are in the tail end of this trend that began 40 years ago based on the cycles approach of Elliot wave. Exact timing is very hard in fact impossible and to be left for the gamblers.
But this 5 wave structure is not just in Australia, it's across the world. Look at the chart below of UK house prices, London house prices in the pink 5 wave structure and UK as whole as well as Scotland, Wales likewise and Ireland showing a truncation. Once again property prices are mirrors of IR in reverse. The IR is largely dependant on the movement of the global bond market specifically in the US.
The only difgference is the magnitude of the rises. Australias market has been much more parabolic in nature and our curve has gone vertical. As you know markets don't stay vertical for very long.
But as I say the key takeaway here is not that the market must turn here, but rather that this current juncture is a 5th wave


