Australian (ASX) Stock Market Forum

Roller's Intraday futures journey

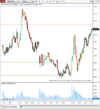
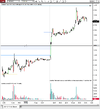
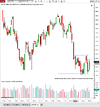
A couple of levels of interest, trend is largely flat over the last few days but I am leaning towards the short side

1666308983577.png
 
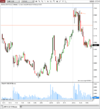
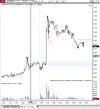
Got a pop off the interim support, I am short from around 955, first target is the green line below, with the longer target at the bottom of the chart if we get some momentum up.

I have taken one contract off here as there was some volume coming in without the follow-through.

1666315689140.png
 
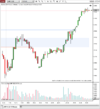
Unfortunately I got stopped out on the high of the day! I had my stop to ticks above the previous high but unfortunately it got hit. Just watching from now.

downside target is 26810

1666329168447.png
 
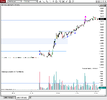
Price ended up making its way down to my target in the evening session. Found support down there and then pushed up to the orange line that I was watching on Friday. This is still an important level I think but it is looking like we're going to gap up towards 27,300. The ES had an impulsive move up this morning but is drifting back down now so I might have to wait a little bit to see what way it wants to go

1666568118544.png
 
The level around 300 held up well a couple of times. Although I was not convinced in the downside up there so I didn't really have conviction. I was short from around where the arrow is pointing, but I still managed to have a losing day… Very very sloppy. I have been good the last few weeks but had a bit of a blowout today, as long as I don't make a habit of it I guess.

The orange line is still in play if price pushes back up there, will be interesting how it reacts once it gets up there

1666590045727.png
 
Looking to see how price reacts once we get up around the orange/shaded area. Not really too interested in long positions until we start pushing up again on the higher timeframes. BOJ announcement in two hours time so if I do put on any trades they'll just be short-term I think

1666918927312.png
 
I've had a better run the last week or so since I've just been focusing on the higher timeframe setups. Sometimes it is easy to get sucked into the lower timeframe charts. But I just need to remind myself to try and see what the bigger picture is telling me
 
No trades yet, fairly impulsive move up leading into the announcement. See what happens within the hour

1666923509220.png
 
Ended up getting a decent drop from that level into the close of Fridays cash session. Very impulsive move up in the overnight US session. Which is making things look more positive for the next week. Unfortunately I won't be at the charts much this week as other things are getting in the way, hopefully get a few days in towards the end.

1667103894884.png
 
I haven't posted here for a while I have just been focused on the charts. But can we just take a second to appreciate this move! Holy heck, I was hoping for a small push up on the interest rate decision for a chance to get in short but wow.

ES copping it too. Good stop raid!

1671505956007.png
 
I should probably start posting a bit more again...

Had a good few weeks and just trying to be selective and take quality trades I also need to harden up and take more size than I can get tight risk. Especially because I'm only trading Sim still... Hopefully on the path going live at some point.

Now that I've been watching the markets most days for a while I am starting to realise why screen time is important.

I'm not normally taking too much notice of the one-minute charts, just for entries but today is a good example of how screen time can identify trades.

Off the open there was a impulsive move straight above long-term's resistance. I was actually short from this level yesterday and still holding one contract overnight. Which was kind of annoying because we closed just below my stop level. oh well.

Anyway just from watching and observing this is how trend days tend to start. You get an impulsive move on volume with no ability to pullback and fill in the move. So I was aggressive once we pushed up into the shaded area which was a possible area of supply. Then you can see we have formed a perfect ascending triangle above this supply which turned into support. Because I really had the majority of my position on with small risk I scaled in a couple of times and put my stop at breakeven.

I took most of the position off at the first point of possible resistance but I think we may like to push higher, I have to leave the office so I thought I would take most of my profit. My next target is just above 200, but I think there is potential to reach 300 today which is a big move on the Nikkei. Especially because I was expecting a quiet day with the Bank of Japan doing an announcement tomorrow

1673918506427.png
 
I ended up closing the long just before that second run up. In hindsight I should have just left it because I had my stop in profit. My target would have been here fairly quickly in the end. From now on I will just let it ride when I have a target and stop in a good position.
1673996658080.png

There is a BOJ decision today which is the last announcement was anything to go by will be pretty volatile. Will be interesting how the morning plays out leading into it.

A retest of either 25900 or a push above 26600 would provide some more information on where we want to go. I've been expecting a bounce above the 26 600 level for a few weeks as you can see from that blue path drawn on the daily chart below. It almost got there but not quite so see what today brings

1673997006424.png
 
No trades yet. Will wait too see what the news release does.

Was looking for a bigger push below the green line for a spring to setup. 1 tick on low vol wasn't enough to peak my interest.

1674008530638.png
 
Big move with the news. i'm still leaning to the downside and will be watching that 550 area marked on the chart.

But yesterday I got caught in the trap of trying to short when we were above this level. Trying to force bias which is what I have been good at eliminating lately. Where that arrow is is basically a perfect retest of a daily level which should have been my entry to the long side if any trades at all.

1674084271198.png
 
Important shortterm level here. Holding for a break. Stop just at BE around 550. Did have a false start early..

Edit: took 1 contract off. Holding 3

1674089880586.png
 
Target is the blue line around 320ish.

Was long ES too but stopped. which is now ripping and making my short seem sketchy.

1674097327554.png
 
Took 1 off not long after previous post and then close the rest around the green highlighted line. Getting towards an area where we might bounce from.

I think if we cannot overcome the 26550 area then we could be looking at a larger move to the downside. daily chart below for some larger context

1674111640546.png


1674111837118.png
 
I am still favouring the short side but wary that we could turn around this area. A test of the line just above current price should give some more indication. Not much support below 250 if we get down there

1674171818375.png
 
I am still favouring the short side but wary that we could turn around this area. A test of the line just above current price should give some more indication. Not much support below 250 if we get down there

View attachment 151903
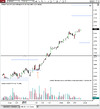
I said I was watching the resistance just above current price for clues. But I got stuck in my short bias.

Initially my short was looking good when we could not push through it, you can see the consolidation under resistance. But then we broke through and retested this should have flipped me long. But I hesitated and just watched price go up. oh well, learn from it.

The strong move up has given me a bit more conviction to the long side but still hesitant. I will look to trade it up towards the zone marked on the chart.

All my levels are a fair way away from current price because of the strong move in the overnight session on Friday. Currently retracing a impulsive move down from a month or two ago.

1674430738927.png
 
ended up the day scratch after taking a small long at the arrow, and then trying to short the pop. It wasn't terrible but I probably could have held the long because of the overall intermediate trend is up. This is an area where I struggle deciding when to flip on an open position or hold.

1674464885687.png
 
Top