Australian (ASX) Stock Market Forum

Roller's Intraday futures journey

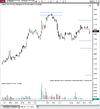
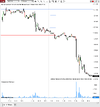
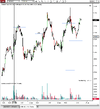
Price just pushed up into an area where supply could come into the market. This is an area that I will be looking for possible shorts from. There is a fair bit of momentum coming up still so I will need to take that into consideration

1674516208758.png
 
Only the one trade yesterday for me. A small short going into the close of the day session from the high of the day. Momentum was slowing as we were approaching some higher timeframe resistance so this gave me some conviction to go short against the trend.

The initial supply area that I was watching from the open yesterday failed and held, I did not want to take any longs there but it would have been a good trade.

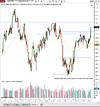
Intermediate trend is still up, although momentum has definitely slowed. Higher timeframe resistance around the 350 area. I watch to see how it reacts if we get up towards 300.

1674603754165.png
 
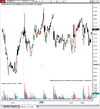
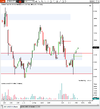
ES is getting smoked but the Nikkei is holding up. Consolidating under the 300 level. Very close to being stopped out
Only the one trade yesterday for me. A small short going into the close of the day session from the high of the day. Momentum was slowing as we were approaching some higher timeframe resistance so this gave me some conviction to go short against the trend.

The initial supply area that I was watching from the open yesterday failed and held, I did not want to take any longs there but it would have been a good trade.

Intermediate trend is still up, although momentum has definitely slowed. Higher timeframe resistance around the 350 area. I watch to see how it reacts if we get up towards 300.

View attachment 152098
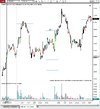
I thought it was game on yesterday when we had a nice reaction of 290. But the bidders stepped up and held it. I got stopped out at breakeven. But before that I got caught in the FOMO game and took the loss so that was annoying.

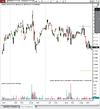
I want to take shorts under current level. That is the higher timeframe resistance area we have pushed up above are a few times and haven't been able to hold so see what this morning brings.

1674689128259.png
 

Attachments

  • 1674608053113.png
    1674608053113.png
    36.7 KB · Views: 2
Interesting @Roller_1

I'd be looking at going long at 27230 targeting the 27760 area for profits.

View attachment 152178
Hi Cam,

we had the same level marked up but that was my first target. unfortunately i was out when we reversed so got out at BE.

I can see why you have those levels but im cautious when we were down there as below a htf level. see it it heads up there tonight


1674723192045.png
 
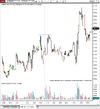
Prices still range bound as we have been for a few days now. Trend is still up but I am going to stand aside until we get a breakeven way. I tend to get chopped up in these ranges. So I will wait for a break either way. I took a small loss today but that's ok.


1675059634706.png

A bit more luck on the AUD today. We pushed up into a level of interest and I went short. Trailing Stop got hit on one contract and still holding one looking for a breakdown.

1675059973026.png
 
Another market. Watching for a bounce off the red line in AUD. Rejection of a big fat daily level overnight

Nikkei is looking like it's getting ready to break out... One day

1675380508655.png
 
I'm looking for an aggressive move through these highs.

Come on FriYay

View attachment 152523

We got a decent push through the high, but no follow-through. I gave it a bit too much room before I flipped short. Ended up a bit better than breakeven. But probably should have flipped bias earlier.

The Nikkei seems to be moving more during the US session than the day session at the moment. I remember a few months ago it was similar, very quiet moves during the Asian session but moving a lot during the US. At the moment it is also not following the US movements as much. Actually sometimes it has been there inverse which is a bit strange. I should actually try and get some stats on that, how often the US session follows the ES. But the correlation at the moment definitely seems to be low in comparison to previous months.

1675636282624.png
 
I have been playing around with python and chat gpt this weekend. Basically with zero knowledge of python and basic programming skills I have been able to extract some data that I think will be helpful for me. Well not at the moment but I have the framework to be able to sort the data sometime soon. Plus a greater understanding on how to do this.

I just want some basic stats like on average when do we put in the high of the day and things like that. This is the first thing that I wanted to work on. Not that it will be super useful but you need to start somewhere on learning these things.

It's pretty cool that you can just basically use a search engine and ask it logical questions to get answers. It will produce code and then explain it to you line by line what is doing and how to use it.
 
We are still in this ugly ugly range. Waiting for a break. You would think there would be a bit of momentum coming out either side with this much consolidation

1676850985160.png
 
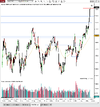
A nice push down out of that range to pick up some liquidity for the big swing up. Approaching some resistance that has been in place for over a year now so it will be interesting how we react at these levels. The Nikkei has been in basically a large consolidation phase since Jan 2022 so it will be interesting how much momentum that has once it breaks.
1677989157874.png
 
The Nikkei has been in basically a large consolidation phase since Jan 2022 so it will be interesting how much momentum that has once it breaks.

I thought it might have a bit of momentum but wow I did not expect this. It has been paying zero respect to any daily levels on the way up in the last couple of days

I have definitely failed to capitalise on all of this momentum. Actually in the worst drawdown I have been… Which is strange because I still feel like I am getting a better handle on reading the charts and what will unfold. Maybe I'm delusional not sure

Anyway, looking for a blow off top at some stage really need to see a huge capitulation bar to the upside though
1684368850098.png
 
Anyway, looking for a blow off top at some stage really need to see a huge capitulation bar to the upside though
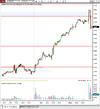
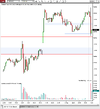
We never really got a blow off bar to the upside on the lower timeframes (three minute) but as you can see on the 15 minute it was very high vol once we broke through the shaded area which is a old long-term high. Price stalled above that and then once it broke down i jumped on the train and got my biggest ever win. Even with missing out on 10 or so ticks because I entered in the initial position in the wrong account.! I was hoping for a bounce back to the top of the shaded area to enter but I ended up getting in around the red line

Due to this I closed out the position once some volume started coming in.


1684371865229.png
 
Another good day today, got the short this morning and covered around the lows once we swept below this range.

A little long once we went back inside, but I've close that. Would love to hold but i'm happy where i am. I may get another chance at a long if we test that 750-40 level. But after such a long move up I'm a bit reluctant. That redline is a multi-year high. We broke above it in the evening/overnight session

1684456057909.png
 
Got the long I was after. Sold into strength a few times on the way up but all out now

1684462274215.png
 
I haven't been at the charts last few days. There was some big selling yesterday for no apparent reason, possibly some profit-taking after the huge run-up.

This deep drop could signal a possible correction to the downside. I think the current level around 700 will be important. If this cannot be reclaimed then I will be targeting moves to the downside.

First target is the red line just above 550 and then the green line. There is a lot of volatility at the moment so getting set in positions might be a bit harder
1684885218819.png
 
A nice fade after we popped off of that 700 level on the open.

Price formed a set up similar to yesterday afternoon, a triangle that looked bullish but once a breakdown I went with yesterday's trend. Thinking once it started to drop away it could really dump like it did yesterday as traders get spooked.

I've taken three quarters of the position off at this possible support area. It would be a good spot to go long if it holds but with the overhead resistance around 700 I think is worth holding a short targeting a larger afternoon sell-off. If it gets above 750 then I will be out

1684893974330.png
 
big pop off that red support area.

imo a good sign that the bulls aren't done yet. 30700 is a major high level set in feb 2021. This was the highest level in decades. In saying that things can change quickly

I've found when the market is volatile levels actually seem to be more accurate. The trick is stepping up and having conviction

1684903942845.png
 
Top