Australian (ASX) Stock Market Forum

qldfrog weekly Skate inspired system

G.jpg

Here's your reason. Everyone are losing their minds over inflation fears. I've made several big posts over in the coronavirus thread explaining how it's a supply-side issue and what's causing it.

I guarantee you that in a few months from now when everyone can get back to work and supply can come online again and bring inflation down everyone are going to be going "what was that all about?".

Happy to help out where I can if you're stuck with something @frugal.rock :)
 
I'm wondering if you have too many systems, or rather, too many factors that systems need to be able to cope with that are getting tested at the moment ?
The whole USD to AUD thing scares me, as it seemingly can get out of hand at a respectable pace at times.

One thing that scares me about systems, is, it would need to be a bloody good system for me to stick to it blindly.
The equity curve is the equity curve. It's honest. Its unbiased. Ideally, It should also fall within system expectancy parameters/ ranges.
One has to love those outlier blowups that push the curve above ranges, but also expect the reverse outliers.
If a system is consistently falling below expectancy, is there something in the rules to deal with it?

Got any charts of your systems growth Frog? If so, do they fall within your expected results ranges?


Giving back gains is not nice, especially when their hard won.
I feel for you there.

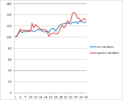
Chart below is self explanatory, and is my "loose" systematic discretionary portfolio based on Skate, Peter2 & Tech/a techniques & methods.
There are clearly periods of time (mostly last year) where i wasn't actively managing the portfolio as well as I could of.
Was preoccupied with family, work, a death etc etc etc, but to me, they (each PITA event) clearly show up in the chart.
I didn't have my mind in the game, wasn't following the flow. Not locking in profits etc. The bloody market nearly caught up!
Portfolio was started middle of August 2020, around 30 weeks.

View attachment 120969

Hopefully once this wave of rising bond yields gets sorted, we have some normalcy return, whatever that is these days.
The whole bigger picture of bonds, interest rates, yields, inflation etc etc confounds me, as I haven't managed to get my head around how it all works.
It really needs a big flow chart with all the affecting variables/ interconnecting links. It seems like the more I learn, the less i know....
Cheers, and have a good weekend Mr Frog.
Will try to post the graph,i have them per system, and i do have some closed systems inc mr Skate happy cat etc which brought profit in the mix
I see no point putting closed ones in,limited point in adding even actived ones together as it would hide looser but might smooth the curve?
 
I'm wondering if you have too many systems, or rather, too many factors that systems need to be able to cope with that are getting tested at the moment ?
The whole USD to AUD thing scares me, as it seemingly can get out of hand at a respectable pace at times.

One thing that scares me about systems, is, it would need to be a bloody good system for me to stick to it blindly.
The equity curve is the equity curve. It's honest. Its unbiased. Ideally, It should also fall within system expectancy parameters/ ranges.
One has to love those outlier blowups that push the curve above ranges, but also expect the reverse outliers.
If a system is consistently falling below expectancy, is there something in the rules to deal with it?

Got any charts of your systems growth Frog? If so, do they fall within your expected results ranges?


Giving back gains is not nice, especially when their hard won.
I feel for you there.

Chart below is self explanatory, and is my "loose" systematic discretionary portfolio based on Skate, Peter2 & Tech/a techniques & methods.
There are clearly periods of time (mostly last year) where i wasn't actively managing the portfolio as well as I could of.
Was preoccupied with family, work, a death etc etc etc, but to me, they (each PITA event) clearly show up in the chart.
I didn't have my mind in the game, wasn't following the flow. Not locking in profits etc. The bloody market nearly caught up!
Portfolio was started middle of August 2020, around 30 weeks.

View attachment 120969

Hopefully once this wave of rising bond yields gets sorted, we have some normalcy return, whatever that is these days.
The whole bigger picture of bonds, interest rates, yields, inflation etc etc confounds me, as I haven't managed to get my head around how it all works.
It really needs a big flow chart with all the affecting variables/ interconnecting links. It seems like the more I learn, the less i know....
Cheers, and have a good weekend Mr Frog.
Quick question @frugal.rock ,what do you use as Market? I use xnt to include div etc
 
XAO or XKO (or individual sector for individual stock)
I hadn't heard of XNT, probably a better job lot to use. Thanks.
Will try to do an equity curve for lot,( a bit of work due to cash injections) so that it does not twist the charts
 
OK, here it is heart warming actually:
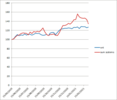
equity curve starting 15/05/2020 brought back to 100 at start for both XNT and equity of systems (9 , 6 still live, 5 started during that period, 3 stopped during that period)
There was capital added so to smooth the line, these additions and withdrawals are substracted from the sum
-> so the 30% return or so on the graph is not the actual representation of the gains as the money available to the systems has been multiplied by 2.5
you will note the heavy fall since 19/02

1615033380308.png

About currencies
I mentioned USD play:in July I had a portfolio of around100k USD or 150k AUD
yesterday these had a 19% increase in USD, I am happy enough with that
but in AUD, 7% only far less positive.
Hopefully this should reverse and boost my returns instead of starving them
 
tonight, I will check the remaining systems and see if I detect any fundamental issues;
the BO system has not had a long live yet so might be worth adjusting taking into account these last 2 months of shaky market
But the main ones will remain unchanged
DLQFDuc has enough history and will remain as is:
1615108390021.png

-----------------------------
On the weekly, I have already set the stop loss and while harder to backtest, I am quite happy with the current setup even if this implies a bit of extra work to set these SL
So far these have triggered 8 times in the last 3 weeks;
of these 8 occurrences, if I had carried on till the monday and sold at open then: only 3 would have been better off for a total of $343
on the other hand, 4 cases were better off, by a total of $1212..not really statistically valid but no need to discard these SLSo unchanged and we keep the SL
But I will recheck the nb of maximum entries as I am artificially slow to enter and also not using the position score I was expecting
More on Break out system later
 
guppy has just been slightly tweaked for its max number of position.not fundamental
BO unchanged but I guess plenty of room for improvement.But I will not rush into quick changes.a recipe for drama
 
ok, now looking at volatility systems, which should have made a killing but failed lamely: pretty easy to see how it is going wrong, so let's try to fix this , in a simple way, and without destroying the part which went relatively well from may 2020 till nov 2020
 
ok, now looking at volatility systems, which should have made a killing but failed lamely: pretty easy to see how it is going wrong, so let's try to fix this , in a simple way, and without destroying the part which went relatively well from may 2020 till nov 2020
Got somewhere for the volatility ASX after a very late night not the best condition to engage the new version with blurry eyes and foggy brain.will confirm tonigh.
So in summary: small improvement on daily and weekly qfduc live, no major changes: part of expected DD in yoyo market.
Daily Guppy relatively new system has seen tweaks part of expected improvement.we carry on.
Daily breakout needs more work.
Volatility US remains to be investigated.
And live goes on
 
So, had a good review on the systems, serious changes in volatility based ones, minor changes on others, but for Guppy which should see better results relatively soon;
Guppy still has too many entries with a low win rate so I need to check that:
is low win rates just along specific periods or a constant;and if along specific periods, maybe get out then

The daily breakout BO system needs more work too;
I will work on these in the coming days time permitting:
So a week where we start flexing the curve and soon going back to profit:(but not yet)
the dailies
DLQFDuc +$0.2k or +0.22% flat, but now 40% invested..just had one packet last week
DLBO: -$0.1k or -0.15%, flat 16% invested
Guppy -$0.3k or -0.5% fully invested

Volatility US:-$0.3k or -1.8%
Volatility ASX:-$1.2k, -2.8%
Weekly QFDuc +$1.2k or +1.24%
overall -$0.5k or -0.13%; the systems are 38% cash today
 
Another eventful week, ramping up the % invested:

DLQFDuc -50$ or flat, but now 76% invested..
DLBO: -$2.4k or -3.9%, fully invested
Guppy -$0.6k or -1% fully invested

Volatility US:-$0.2k or -1.3%
Volatility ASX:-$0.7k, -1.6%
Weekly QFDuc +$3.2k or +3.31%
overall -$0.7k or -0.18%;
 
ok, bite the bullet: the BO system is crap: not only with results..that can happen DD, etc
but checking entries after entries, it is not right, enter too late usually after the actual BO, and just getting the redraw..and exiting: a loss making factory.I can not see visually what it is supposed to achieve based on initial concept design
I will stop all entries there and slowly wind it up..a costly mistake...
so back to 2 volatility, one weekly & one daily trend qfduc and one guppy.
Back to the drawing board
If you don't mind sharing what was the process to get to this point? Sounds like it might have been profitable in the back test but didn't necessarily 'make sense' of why it made profit?
 
ok, bite the bullet: the BO system is crap: not only with results..that can happen DD, etc
but checking entries after entries, it is not right, enter too late usually after the actual BO, and just getting the redraw..and exiting: a loss making factory.I can not see visually what it is supposed to achieve based on initial concept design
I will stop all entries there and slowly wind it up..a costly mistake...
so back to 2 volatility, one weekly & one daily trend qfduc and one guppy.
Back to the drawing board


I suspect that it is the wrong market environment for a BO system. A BO system is a real bull market system. The current market has moved from Bull to neutral, or even possibly a very early Bear. We won't really know until a little further down the track, but either way, now is time to play defence.

jog on
duc
 
If you don't mind sharing what was the process to get to this point? Sounds like it might have been profitable in the back test but didn't necessarily 'make sense' of why it made profit?
I suspect i am partly responsible:
1 initial development was tested properly and never too flash but profit making enough
I was keen to enter a..any..non trend system.
Then i tweaked it using probably non compatible exits ranking.and delayed the full review too long.
It was my last system pending review after the fall i got a month ago.
I could rerun the backtests again with my final system but basically not doing what it was supposed to do when checking signal on charts
very quick forensic, as is the BO system should be profitable on the long term, but higher dd and in any case well below the performance of my other trend systems, while actually faring worse during these yoyo time.Sure it was a nice idea, but why should I even bother if there is no either diversification or performance advantage. My search for de-correlation/system diversification blinded me on this obvious fact.
And with no clear trend break out are very susceptible to lash back;
This very morning one of my packets FLN was a nice proof of the yoyo behaviour
1616659712781.png
huge paper gain at opening ending up in a lame loss
Anyway, this BO system is probably not worse even considering in other times
I will discard it and slowly sell the remaining packets
 
I suspect that it is the wrong market environment for a BO system. A BO system is a real bull market system. The current market has moved from Bull to neutral, or even possibly a very early Bear. We won't really know until a little further down the track, but either way, now is time to play defence.

jog on
duc

very quick forensic, as is the BO system should be profitable on the long term, but higher dd and in any case well below the performance of my other trend systems, while actually faring worse during these yoyo time.Sure it was a nice idea, but why should I even bother if there is no either diversification or performance advantage. My search for de-correlation/system diversification blinded me on this obvious fact.
And with no clear trend break out are very susceptible to lash back;
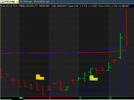
This very morning one of my packets FLN was a nice proof of the yoyo behaviour
View attachment 121868
huge paper gain at opening ending up in a lame loss
Anyway, this BO system is probably not worse even considering in other times
I will discard it and slowly sell the remaining packets
Just a bit of friendly challenge. I don't know your system Mr frog, but over 1000 trades is the system broken or just the recent chop we are experiencing?

If it is the wrong market type, maybe the solution is a system filter or retaining it in your basket of systems but not necessarily that the system is broken.

Not saying either of you are wrong, but a different perspective.
 
@Wilham It's using mathematics and systems in atypical market conditions. I'm hopefully going to get my basic chart analysis/reading thread up tonight and I've gone to painstaking lengths to explain why you shouldn't be relying on number crunching in a market environment like this one.
 
Top