Australian (ASX) Stock Market Forum

P2 US Equity Portfolio

Another example that we live in interesting times.

The change happens May 19th and I don't expect I'll still be holding them. POG is refusing to rally on it's own and seems to be waiting for a bounce in the US markets.

I suspect many ETF administrators are scrambling behind the scenes with the increased volatility.

You may not be aware that a few weeks ago a volatility ETF, TVIX consolidated (reverse split) because the price was getting low as the market made new highs. It split 3:1 I think. I remember it was $15 then, overnight it went to $45. This was just before the market tanked and volatility went through the roof. TVIX went to the moon ($999.90).

tvix2303.PNG
 
This is why my positions in the 3x leveraged ETFS, NUGT and JNUG aren't going as high as they should. Gold has had two huge up days and the ETF prices haven't reflected this fully.

From the Direxion website:

2403E.PNG

This problem was probably the cause for the significant falls of both JNUG and NUGT near the US close last night (23/3) when the POG didn't fall.

If the administrator's having problems behind the scenes then I don't want to be involved in a trade of that instrument. My positions were only small (4% of the account) and are currently +1.2%. If they're having problems then I'm unable to use a tight trailing stop. Close out or continue ?

ps: Are the twits whinging?
 
The 'miners' are not following the 'physical'.

Physical gold is a hedge against current situation. The 'miners' are not, or less so.

jog on
duc
 
This is why my positions in the 3x leveraged ETFS, NUGT and JNUG aren't going as high as they should. Gold has had two huge up days and the ETF prices haven't reflected this fully.

From the Direxion website:

View attachment 101668

This problem was probably the cause for the significant falls of both JNUG and NUGT near the US close last night (23/3) when the POG didn't fall.

If the administrator's having problems behind the scenes then I don't want to be involved in a trade of that instrument. My positions were only small (4% of the account) and are currently +1.2%. If they're having problems then I'm unable to use a tight trailing stop. Close out or continue ?

ps: Are the twits whinging?
This fact was raised by @InsvestoBoy i think in another thread..it is disappointing to see rules changing under your feet indeed.
 
Direxion has changed their minds again and have brought forward their planned reduction of leverage from x3 to x2 to tonight March 31st instead of May 19th. I'm out thankfully.

The recent volatility has crushed all of these x3 leveraged ETFs. The under performance of these ETFs was only seen in the medium and longer term but the recent huge increase in volatility has seen their poor performance being exposed daily.

They won't be worthwhile trading until Direxion reset them to higher values with a reverse split (consolidation).
 
I have not forgotten the US markets even though I haven't posted here for a while. I day trade the US a few times each week and I'm currently doing some forward testing of a 1st BB swing system that I intend to use in the new year. The ASX spec portfolio has done so well that I'm going to trade US spec stocks in a similar portfolio style starting with approx 12 - 15 positions. I'll add more if it starts well. My universe atm is the bottom 1000 in the Russell 3000. They're not totally rubbish like the OTC markets. I always need plenty of other traders to allow me to profit and exit my trades.

Things are going well, as they always do when there's no money involved. Then I came upon this chart... OVID

OVID1.PNG . . . Drug company awaiting results of trial.
Nice break-out with above average volume. The 1st BB also with high volume was earnings. I didn't see this chart yesterday so could not buy it on the next open which ended as a down day with very high volume. That's ugly and I would handle this by buying when price trades back above 7.00. Seeing as the US is open I punched OVID into Tradingview.


ovid2.PNG Yep, OVID has opened 55% down. Yikes. Their ph 3 trial failed to meet the endpoint.

I think a few people knew the results yesterday (high volume down day) and sold before today's public announcement.

This is a -3.7R loss and reminds me of what can happen. Spec stocks always provide thrills and spills.
 
US Spec Portfolio: I'm going to establish a US Spec portfolio using similar methods I'm using for the ASX Spec portfolio.
The abbreviation "Spec" is short for speculative. Typically, low priced equities that occasionally show a rapid increase in price that usually disappears just as quickly. Very occasionally price may turn into a medium term trend. It's preferred that the stock prices move on company news or sector outlook rather than follow the main index. Movement of the main indices can't be ignored and I'll be looking for equities that are stronger than the index (RSC(QQQ)).

The ASX spec portfolio is going so well that I've spent more time looking at the US markets again. I've been meaning to do this for some time but it's been hard going settling on a strategy and finding the right universe of stocks. Most strategies I researched produced great winning trades, but I also had to wade through what seemed like about 10 duds for each winner. The US markets are just so big. I haven't yet found a filter to weed out many of the duds.

I'm excited, too excited to sleep. I've had a break through. I came upon a universe of equities that seem to behave how I want. I'll need to refine it some more but I should be able to start with the Russell micro caps. The second aha moment came when I combined the three strategies that I was researching. It's the same three strategies I use in the ASX. Sound familiar? I've always liked @Skate's hybrid approach.

I'm not going to go into many details at this stage as I've posted many comments in this and my other threads. The setups will be pull-backs, pocket pivots and break-outs. The entry triggers will be CBL(2), 1stBBs, HVBBs and box breakouts.

I'll spend tomorrow (that's today) writing out the trading plan. I intend to start forward testing immediately with a small amount of capital.
 
Its exciting to hear you're excited Peter2 :)
I happened to take in Chat with Traders podcast#205 this week - Michael Katz from Seven Points Capital.

Reading what you've shared above reminded me of a small section near the end of the podcast where Aaron Fifield asks MK what he sees as the attributes of the best traders. People can listen for themselves from 47:37, or briefly these people tend to:

* Have an entrepreneurial mindset, always adapting​
* Very aware of performance and their stats​
* Do more of what's working, cut out the mediocre trades​
* Have a good understanding of what it is they do well, and​
* What segments of the market they read well, and they focus there

The positive feedback and energy from yourself, Skate and others here is impressive and there are probabaly lots more reading along learning and being encouraged/energised. Many thanks.

 
All that enthusiasm I had last week-end is all but gone. Luckily I've got a bagful and can grab some when I need it. Traders must have a supply handy because the market will wear us down if we let it. Why am I off the high? Well, the market went sideways and my trades went up and down and ended with nothing to show for the week's work. Don't we hate that.

I'm also still battling with the sheer volume of opportunities in the US markets. Oh, there's another annoying behaviour that the US markets show. 80% of the stocks move in a similar manner to their index. Even in the micro cap sector, stocks have a tendency to follow the index once the glow of specific corporate news has passed. This is a problem for two reasons. Firstly, the number of opportunities vary greatly depending on the price action of the index. Secondly the follow through after being triggered varies considerably and also depends on the price action of the index.

Two examples. When the index has a minor dip and starts to rally there are hundreds of perfect setups and there's great follow through. The strong stocks hit high targets while the weak stocks hit lower targets. Relative strength is key and must be included in the system. Last week the index paused in their moves higher and most stocks (80%) also paused. This isn't a good time to start lots of new trades. The opportunities dried up and those that did trigger didn't go very far.

In summary: I think I've got to analyse the index first (market type, mood, style), then scan the stronger stocks for the setups that are suited by the current market type. Refine. modify, refine and modify.
 
I totally understand why some people prefer to trade just the US indicies or a few sector ETFs or a small number of familiar companies. I know that if I had traded the small list I posted near the beginning of this thread I would have had plenty of opportunities, some great results and earned a reasonable profit for the work.
 
Ducati's comments deserve to be posted in this thread for later reference.

As I'm sure you realise, there are some serious differences structurally in US markets:

(a) Market Makers (these chaps WILL RUN stops intra-day);
(b) Prop Shops (run time and type strategies throughout the day) you need to be aware of their propensities (larger ones);
(c) Federal Reserve;
(d) Hedge Funds & Algos skimming the spread (front running);
(e) Hedge Funds running quant;
(f) Indices Arbs;
(g) Options market;
(h) Futures markets;
(i) Arbs from both markets (above);
(j) ETFs;
(k) Mutual funds;
(l) Social Media based traders;
(m) Other


Then you have the very defined trading periods in the day:

(a) Pre-market (increasingly everyone);
(b) Open; (Prop Shops, Algos)
(c) 10am zone;
(d) lunch; (half-wits);
(e) pre-close (Prop Shops, Algos)
(f) close (Arbs)

What has become increasingly apparent is that the monitoring of social media is now a requisite or at least some live scan during the day to catch movers. Part of the problem (for day traders) is that the social media crowd operate in the Options markets for leverage, which transfers to equity markets as MM adjust their books. The 'timing' is very squiffy, which can really play havoc with a 'trend' in swing trades.

What I used to do was trade Corporate news. On any given day, someone is releasing news that has the potential to be market moving. You identify at the w/e those companies releasing through the week and select a shortlist for each day, the ones you think will fly. Jump on as many (or few) as you can each day. The momo lasts at least for an hour or so, sometimes longer, enough anyway to profit. Earnings season is obviously a rich environment for this type of trading. Obviously (or maybe not) the time of day that the release is issued can have quite an impact. Pre-market are probably best (although that may have changed now with so many trading the pre-market).

Swing trading is a tough one. Hard to keep it tight. May need to give each position more breathing room, which if it turns to custard, creates issues. Most of the successful chaps that I am aware of, limit the duration of the position via exiting on targets rather than trailing stops etc. which makes the average swing trade just a few days or so. Personally, I think this is the toughest time frame, just so much can go wrong, especially in the wrong sector at the wrong time (biotech!). ETFs are more 'stable' but you (as stated) are giving up returns as compared to the outperforming constituent stock superstar. I'd love to see some of @Skate systems operating in the US markets. He has said that in backtesting they performed well.

The longer term is a niche that sits most comfortably with me now.


I'll be following your experiment, methodology, with interest.

jog on
duc
 
I'm disappointed that I've not documented a consistently profitable approach for trading the US equity markets in this thread. I think it's because I've always considered trading the US as a hobby rather than a serious activity. I pay my expenses and grow my capital trading the ASX market. I've been closing accounts that I haven't used in a while and am considering closing the US account as well. However in the recess of my mind there is a nagging feeling that I haven't proven myself in the US yet. It's an itch that needs to be scratched.

I've mentioned elsewhere I could use the US account to have a bit of fun. I did consider entering a trading comp and the idea to develop a combined long/short portfolio. Everybody needs a hobby, so why don't I make mine earn some pocket money?

I would like a trading activity that doesn't take up very much time and mostly swing trades but allows me the flexibility to day trade when I want and to occasionally risk a little more when I've a high conviction opportunity. I would like to earn much more than the easy 10-20%pa say 50-100%pa. Just for fun?

I've circled back to an idea that I had at the start of this thread. That is, to swing trade a small number of ETFs. I monitor the US indices and many commodity markets because it helps me trade the ASX. Why not trade these ETFs and earn a little extra.

That's what I've been doing since late Jan22. The list comprises the four main US indices and their ETFs, some commodity ETFs, inverse ETFs and some of the main US sector ETFs. The list currently has about 55 entries. Many of these entries are duplicates or alternatives.

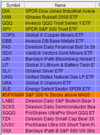
USlist.PNG

A top portion of the list. The colours keep the list sorted into their groups.
 
I realise that by not outlining my trading process, this thread becomes just another journal with little educational content. My excuse is that the process is still under development. This should be competed before the end of March. I'm developing a flowchart that shows the process that allows me to do a little or a lot. This means that when I'm distracted and with little time I can just focus of the top 4 ETFs. Buy the strongest or short the weakest. Whatever my directional bias is at the time. No need to look through lots of charts.

When I've more time I can review the commodity ETFs then the US sector ETFs and then perhaps look through the US sector watchlists to trade the strongest or weakest stocks in that sector. I'll determine my directional bias for most ETFs on the week-end.
eg When I'm bullish copper (like now), I could trade the COPX-ETF or I could trade a copper producer (eg FCX, SCCO, WRN) and watch the ASX copper stocks (OZL, SFR, 29M and assorted explorers) for bullish setups.

I started this activity in late Jan and the results were a massive +$4 for the month.

US22JAN.PNG
 
Feb 22 update: with one more day to go.

pfusfeb.PNG

100% winners for a gain of 6.3%. 11 trades for +11.2R Grabbed lots of small wins but they add up.
The wins were small because I used larger iSL sizes due to the increased market volatility and the TR value was only 0.5% ea.

When the market volatility decreases I'll use a TR of 1% per swing trade (0.5% per day trade).

In order to reach my minimum goal of +50%pa I must average +4% each month.
In order to reach +100%pa I must average almost 7% each month.

I plan on outlining my process for educational content when I'm comfortable with it. I will post a few of my higher conviction opportunities when they form.
 
I know what I want to do, not exactly how I'm going to do it. Allow me to post my thoughts as I do the weekend review.
Each weekend I will review the top20 list that I posted earlier. I only need to find a few ideas for the week.

(i) Determine directional bias from the weekly charts. Focusing in on the current trend, overall formation and the last few weekly candlesticks.
(ii) Determine the strength or weakness of the instrument relative to the SPY.
(iii) identify a trade opportunity on the weekly chart or wait for one to form on the daily chart that agrees with my directional bias.
(iv) I can trade the weekly charts but that won't help me reach my yearly goal. Daily swing trades and an occasional day trade is what I need.

US indices : Directional bias is down on all four. The strongest is DOW, weakest Russell.
However, last week's bar was a hammer, bullish reversal. Seen on all four charts.
Trade Opp. is to go long above the bar and iSL at the low. However the risk size is too big using the weekly bar.
Look for a smaller sized setup to go long during the week. I'll look at TQQQ, UDOW and UPRO for this setup.

Inverse/VIX ETFs : No directional bias as prices going sideways with last bar a bearish one.
VIX is midrange on the daily charts and could go either way due to current Russia/Ukraine situation.
If VIX spikes high enough I'll short it again (UVXY, VXX).

Commodity ETFs
: Aim with these is to get in as soon as the trend starts. I'm too late for oil, nickel, base metals, tin.
This may mean a reversal or to find something in a consolidation (Break-out, HVBB)
The second best setup is the first pullback or pause after the BO.

COPX: Long and strong. Too late now.
DBB: Long and strong since the BO in Dec21. Already had 2 pauses/PBs.
FAS/KRE: Banks, huge bullish hammer. Look for a smaller sized setup to go long during the week.
GDX/SLV: Long and strong, volatile. Look for a smaller sized setup to go long during the week.
JJN : Nickel, Long and strong since pullback late Dec21.
LIT: Down trend, one bullish bar only.
Need a HL on daily chart for reversal trade.
UNG: Nat gas. Volatile bugger, wait for another low
URA: Uranium, going sideways, bullish engulfing last bar, Need a HL on daily chart for reversal trade. BO-NH on UEC, URG
XLE/USO: Long and strong since Jan22. Intraday longs only

That didn't take too long and provided quite a few trading opps for the next week. I'll note them and keep an eye on them before each US open. Just remembered to add WEAT, CORN, SOYB to commodity list. Any others worth adding?

REMX: Low volume, tends to follow LIT but is currently stronger
MJ: Cannabis, strong down trend
SOXL: Semiconductors. Currently long and waiting to add more. Bullish this sector, but needs a rising market.
TAN: Solar, currently going sideways last bar bullish engulfing, interesting.

US Sector ETFs : Won't look into these as I have enough opps to monitor next week.
I did sneak a look and noticed lots of bullish bars similar to the major indices.
Just want to add:
I really understand you
the beauty of US ETF is that they give you long access to shorts: so for systematic traders, a one size/system set fit all:
If copper goes up i can go long a copper ETF in a trending system, if it goes down, i can use an inverse etf and go long on it.
So just define your realm and launch your system, the lot with very low brokerage fees
And so easy to buy sell US shares at market.
I am not system trading the US market but it is very tempting.
But first for me: focus and trying to be profitable on the asx.
Looking forward to follow your experience
 
Quick update on this weeks work for the US markets. (Ideas highlighted in orange, only)

US Indicies: Bullish until price closes below halfway of last weeks bar.
We got the down day that we wanted and now I'll go long if yesterday's high is breached. Looking for the strongest market. It'll either be TQQQ or TNA.

VIX: Spiked higher yesterday, just a little more tonight and I'll start a short.
Looking at UVXY > 22 or if I can't short that one (sometimes happens), VXX >28

Banks: Crashed and burned Tues. Closed too low to remain bullish. the time will be right soon.
Note: Saw talk of US defence stocks in demand. Checked DFEN, yep blasted higher, too late. Would need to see VCP here.

Commodities:
LIT: Got the down day, Buying up through 77.20
URA: Gapped up, fell, no long setup yet. ASX uranium stocks all up again. Think I missed it this time.
OIL: Wow, +10% in a day. Has to be a good short in there soon or it could be another +5% day, Very volatile.
GDX,SLV: gapped up, pretty volatile currently.
TAN: Continued higher, waiting for pull-back for better R:R setup.

That's it. All up once I've planned the ideas for the week it takes very little time to check them before the US opens.

Sometimes I'll have more time and I'll look through the other ETF charts and maybe get into the strongest stocks in the sector. Looked into the solar sector last night and realised I should have looked before starting one trade. Story for another day.
 
US Market Week-end Review:

(i) Determine directional bias from the weekly charts. Focusing in on the current trend, overall formation and the last few weekly candlesticks.
(ii) Determine the strength or weakness of the instrument relative to the SPY.
(iii) identify a trade opportunity on the weekly chart or wait for one to form on the daily chart that agrees with my directional bias.
(iv) I can trade the weekly charts but that won't help me reach my yearly goal. Daily swing trades and an occasional day trade is what I need.

US Indices: Two weeks ago we saw the reversal hammers in these charts. Normally considered bullish but there was no follow through bullishness last week. Last week's bars are small bearish bars. We could remain bullish as the low of the hammer hasn't been taken out and trade long using last weeks action as a minor pull-back. OR we could be bearish with the current daily trend.
Strongest - Dow, Weakest - QQQ ; Value stocks stronger than growth stocks,

No one likes these either/or situations. The probabilities are even or one side is not big enough. We can avoid these situations by looking for easier charts to trade. My trading opps here would be intraday only and to trade with the current sentiment (bearish).

VIX ETFs : Slowly going higher. Will watch for spike up for shorts on UVXY/VXX.
Currently long UVXY as an offset to a losing SOXL positions.

Assorted ETFs :
SOXL/SEMI: Bearish and we're not at a bottom yet.
COPX : Strongly bullish.
CORN : Bullish, becoming too volatile at these levels.
DBB : Base metals, strongly bullish, if you aren't in already, missed it.
FAS/KRE : Banks, crushed last week, near lows. I can't short them, so I'll have to wait for reversal setup.
GDX, SLV : Gold/silver, hi ho, up and away
JJN : Nickel, flying high, like Icarus
LIT : Lithium, bearish, but I can't short this due to bullish fundamentals, will have to wait for bullish reversal setup. It's interesting that SQM chart is so bullish while ALB is bearish. There's something there that I'm not aware of. Anyone?
SOYB : Looks at the end of a strong bullish trend.
UNG : Nat gas, it all depends on Russia, so out of my hands as it would be a gamble.
URA: U308, major panic selloff on fire near Ukraine nuclear facility. This could be a setup for bullish swing.
WEAT : Wheat, futures continue to having limit up days. Very volatile.
XLE/USO : Oil, this is going to open with a huge gap up on Mon, possible intraday short for me at the high price

ARKK : Must be giving Cathy nightmares by now.
BITO : Come in spinners
CIBR : Stronger than the QQQs, may provide bullish setup if market helps
DFEN : Defence, bullish (LMT, NOC)
IYR : Real estate, looking bullish off low
TAN : Bullish, watching SEDG, ENPH
XLV : Healthcare, bullish
Fertilisers : MOS, LXU, NTR for intraday longs.

The charts I'll be watching closely this week for setups are highlighted in orange.
 
Top