Australian (ASX) Stock Market Forum

Oil price discussion and analysis

Given all the weirdness around this commodity
Something to always remember with oil is that if you look at a list of the largest companies by production volume then you're substantially looking at a list of governments.

Looking at the top ten, only ExxonMobil (6th place) and Chevron (9th place) are companies owned by shareholders and operated with the focus being to make a profit.

The rest are either outright government owned or are quasi-governmental enterprises in practice.

Saudi Aramco, Rosneft, Kuwait Petroleum Company, National Iranian Oil Company, China National Petroleum Company, Petrobras, Abu Dhabi National Oil Company and Pemex. All are either tied to governments at least partially.

Never forget that when investing in oil, you're playing alongside governments. Plus the reality that price has been influenced by a cartel for more than 90 years now. Texas set the quotas from 1930 until the early 1970s and since then OPEC has done so.

I'll trade oil but always with that in mind. :2twocents
 
Cheers, Smurf, you put much better than I could. The weirdness I had in mind was definitely that it's a heavily manipulated commodity - also specifically that it's gone to a notionally negative price last year AND you'd be betting on something that's supposed to be on the way out, which might seem odd to do long term.

For manipulation level I'd say it's more than Shanghai Composite Index, less than silver, much less than diamond price - but I'm pretty sure the cartel never wanted oil to go negative.

My sense of the muscle memory of this one, looking where it's been, is that it will get up nicely again before its day is done. But unless one is a diehard, pure chartist, it might be inappropriate to study the patterns too obsessively with something so manipulated/influenced. That being said, I'm sure some will say e v e r y t h i n g is in the chart - almost "as I look at the price of oil I can tell which of his wives the sheikh was with last night and what she wore" etc. So, as always, DYOR :)
 
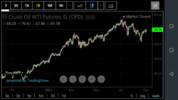
Bull flag pennant thingy.
WTI up around 5.5% overnight.
Action more in line with diminished US crude stockpiles reported last week.
Will it hold, or will it continue the trend. Stay tuned.
4 hour bars

Screenshot_20210824-081514.png
 
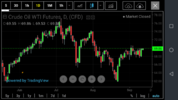
So after oils peak around 2 months ago I have been keeping a lazy eye on it.
Had anticipated a more solid move up than we've seen, together with it got a lot more volatile than I had expected, for a longer period than expected.

Current conditions are pushing the price up (lower US crude weekly stockpiles and fallout from hurricane Ida).
OPEC hasn't changed their stance yet and production will increase each month as agreed.
The weekly stockpiles are seemingly the best indicator at the moment for pointing the immediate price, although refinery runs and imports are also used. It's noted that both of these were down for the week.
Of interest, US gasoline stockpiles were slightly up indicating a slow down in US driving (seasonal) and or a slowing from Delta damage.

Have entered OOO again on Wednesday and nearly added to it yesterday on the slight price weakness seen yesterday. I'm kicking my hindsight this morning, stupid ass!
I know not to follow the poo from our market and the slight weakness yesterday stalled me.
Divergence between WTI and Brent noted to be around $3.07, hopefully this scenario will pull WTI up to around $71 in the short term.

Screenshot_20210903-084658.png
 
Update.
The POO pushing up again.
Fallout from hurricane Ida still apparent. Most refineries are back online after power outages stalled their return, however the Biggie, supply out of the gulf of Mexico is damaged badly.
Some supply has come back, but full restoration is unlikely to occur any time soon due to damaged sustained.
Thee POO got shocked by the Saudi news of selling to China at a minor discount, and then China announcing it has started releasing strategic reserves, funny how the market took this news with a sell down.
In reality, I see it as China securing a future supply line AND current shortages necessitate releasing strategic reserves.
What was the market thinking?
Typical panic first, ask questions later scenario, in my opinion.

So that leaves the other elephant in the room, delta covid.
Everyone's getting tired of hearing it. Governments are turncoating policy again to the realities of "living with covid" and the scenario of "in vaccinations we trust". A true, living with covid, but dying from debt, world.

So, with Saudi, China and covid delta already largely factored into the POO, we have yet still to get full ramifications of a large supply withdrawal due to hurricane Ida.

Am anticipating oil to go for a further run this week, especially after mid week snapshot of US reserves are out.

Cautiously bullish on the oil ETF OOO. End of the month sees FY21 results out.
Going by last year's results timing, investors had very little time to peruse results and make a dividend based trade decision...

Screenshot_20210913-082010.png
 

China announces first public state oil auction to stabilise prices​


China plans its first public auction of state crude oil reserves to a select group of domestic refiners, the reserves administration announced
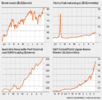
Given there doesn't seem to be any physical shortfall of supply in China, at least not that has been reported in Western media, this would seem to be an attempt to influence price and nothing else.

How much oil they plan to sell is the question. Apart from China's government itself, I doubt anyone knows that with any certainty indeed even how much oil they have in storage in the first place isn't certain (though various estimates do exist).

Also of relevance to oil is that spikes in the price of natural gas are popping up all over the place. It's happened in Japan, it happened in Australia recently, now it's happening in Europe. Also prices in the US are slowly but surely creeping up.

Now natural gas isn't oil but if you can't get enough gas physically, or it becomes too expensive, then for industrial and power generation users the workaround is to burn oil-based fuels, particularly diesel, instead. So any physical shortfall of gas supply does have the potential to spill over into increased physical oil consumption with associated price impacts.
 
1633155113397.png

Record-breaking prices for energy commodities have exposed structural weakness and under-investment in the gas, coal and oil markets as the world grows more power-hungry, translating to a supply problem for which there are no easy answersRecord-breaking prices for energy commodities have exposed structural weakness and under-investment in the gas, coal and oil markets as the world grows more power-hungry, translating to a supply problem for which there are no easy answers.

S&P Global Platts’ Japan-Korea-Marker or JKM, widely used as a benchmark for spot LNG contracts, soared 8.9 per cent to a record $US34.47 per million British thermal units (mmBtu).
US natural gas surged 8.2 per cent to $US5.92 per mmBtu.
 
Things are looking up across the energy complex:
1633220599579.pnghttps://www.tradingview.com/x/7rujMZJH/
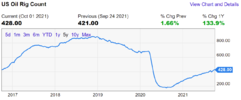
Meanwhile the North American OIL rig count has shown steady increases since October last year but remains well below pre-pandemic levels (note that this chart does not include gas drilling rigs).
1633219429257.png
What the chart does not show is when the fracking frenzy began.
In May 2016 a decadal low oil rig count of 316 occurred, and within a year it had increased to 722. It peaked at 888 in November 2018 before declining due to POO dropping some $30/bbl in a matter of months from its peak in October 2018.
Many frackers never made a profit and banks today remain wary of the industry.
Although POO remains well above breakeven prices there has not been a flood of drillers returning to the oil patches.
However, as noted from 2016, frackers are nimble and the right price trigger can quickly change the picture. If and when it does any oil stock you hold will be susceptible to what happened back in October 2018.
 
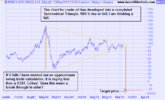
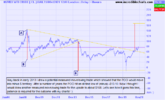
Way back in May 2013 I put up a chart for the POO showing it would dump into minus territory, it was way too early for the call as the price hadn't broken out of its symmetrical triangle, it took some time to make a move as it just jogged along sideways for some time. The symmetrical triangle had to be redrawn eventually but the overall pattern remained consistent and the outcome recently concluded the way I suggested from what I read in the chart back in 2013 to minus -$13.10. I tend to remember I had people scoffing at me at the time but meh, it wasn't the first time (gold's fall call in 2012) and undoubtedly won't be the last! :)
So now just for fun I have done a measured move/swing trade for the POO for the upside. It is suggesting it could hit around $168, let's see how it goes! I am holding an oiler after the POO broke above the long term 13-year falling overhead trendline. So money and mouth so to speak! ;)
POO swing 10.10.21.png

And just to substantiate what I am saying about my 2013 call, it turns out it wasn't a breakthrough with solar it was an oil fund caught on the wrong side of a trade! Here is my old chart just for a laugh!

oilsymmetrical15may.png
 
So now just for fun I have done a measured move/swing trade for the POO for the upside. It is suggesting it could hit around $168, let's see how it goes! I am holding an oiler after the POO broke above the long term 13-year falling overhead trendline. So money and mouth so to speak! ;)
I'm long oil too. If oil hits $168 I will be retiring for the second time, this time on the Gold Coast sipping martinis every day!

KH
 
WTI Crude over $80 a barrel as supply tightens and demand surges. Increasing energy prices is only going to see inflation continue to rise and keep a lid on economic growth.

Looks like we're in for an expensive Christmas at the petrol bowser.

cl1_com.jpeg
 
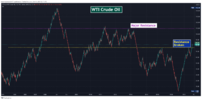
The POO chart has 3 times previously moved between these resistance levels:
1634523579713.png
Assuming trend continuation then we are looking around April 2022 for POO to again be at $100/bbl.
OPEC is not ramping output and frackers are slow returning to their shale oil patches.
Hitting a +$100/bbl target again is no longer pie in the sky.
 
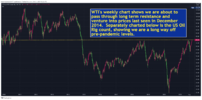
POO hit a new closing high overnight - its best since November 2014:
1634941229205.png
Surprisingly, the Baker Hughes rig count actually declined:
1634941327899.png
Looks like another good start for our oilers on Monday.
 
I'm going to guess that:
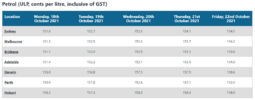
  • when prices are rising there is a direct comparison in the rate of increase between the price of oil and the price at the bowser
  • when prices are falling, the rate of change of the price at the bowser will lag significantly behind the the rate of change of the price of oil
I really need to get to the next meeting of Cynics Anonymous.

KH
 
Top