Australian (ASX) Stock Market Forum

Oil price discussion and analysis

Below I have indexed some Oz oilers against POO, based on pre-pandemic pricing.
As you can see, none are close to matching the relative performance of POO after WTI prices fell off a cliff.
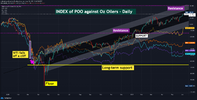
NqScsuf1.pnghttps://www.tradingview.com/x/NqScsuf1/
I don't know if @frugal.rock is long equities, or just POO.
But as I posted earlier, our oilers have a lot of catching up to do, and they usually do do.
 
Fracking or no fracking, my memory has them only tipping the net exporter mark December 2019.... check it if you like.
Was following it closely at the time....

View attachment 125488
The missing actual figure above is around -5.2 ... unless I'm mistaken.
(Investing dot com has been a bit of a pain lately.... missing figures etc)
I'm vested 25% of my portfolio long on oil price rising.... hope I know what I'm doing.?
Fair enough.
I was working in O&G for many years and I seem to remember very well in about 2015 or so seeing graphs of production and usage. I was long oil fir many years up to $150 then pulled out at about $60
 
Fracking or no fracking, my memory has them only tipping the net exporter mark December 2019.... check it if you like.
Was following it closely at the time....
There's few complicating factors in it all which lead to different answers from the same data.

First and most significant is that some US data doesn't treat imports from Canada or Mexico as an import due to economic treaties.

Some goes a step further and includes all production in the Canada and Mexico regardless of where it goes. So it's North American oil production in total not specifically the US alone.

Can't really argue with the above, it's factually correct so long as it's clearly stated that's what it is. Can be misleading though if it's not stated and the reader assumes it's US specifically.

Some does do something "dodgy" however and includes biofuels as oil. Now I don't care what anyone thinks about the merits biofuels but no, ethanol made from agricultural crops most certainly is not crude oil just as timber is not steel. An alternative to it arguably yes but not the actual thing itself.

How LPG is counted is another gotcha in all this. International convention is that propane and butane are "oil" and that applies regardless of the source of those gases (LPG being both a by-product of oil refining and of natural gas production). But then some put LPG in the "gas" category to confuse things....

Another gotcha is crude oil versus refined products and omitting one or the other from the data.

It's pretty easy to work out that New Zealand is a net oil importer for example but it's somewhat harder to crunch the numbers for the US due to the above. You need to be very careful as to what data's being used and make sure it's including everything that is oil and nothing that isn't. :2twocents
 
Thanks for your insights Smurf.
Your a proper Oil (data) Barron ! ?

At the end of the day, I'm only interested to know if the POO is likely going up, down or sideways.
I was thinking if I consider that supply is relatively inelastic, then US crude oil inventories would be a good measure of US consumption.
As a basic metric @Smurf1976 is that a fair assumption?
Or would you or @Gunnerguy have other simple metrics I could use to speculate?
Cheers.
A very stupid suggestions: i do not believe there is a pipeline bringing south america (Venezuela) oil to the US, so a clear indication of the US (more specifically north america) net importer exporter status should be available by tracking the oil tankers traffic?..and as you say, on the ground storage.
 
Thanks for your insights Smurf.
Your a proper Oil (data) Barron ! ?
Oil baron - now there's an idea! :laugh:

The official EIA (US Government) data for import and export is here:


Trouble is, once you start looking at other EIA data for product supplied to consumers, US production, imports and exports well the basic problem is the figures don't add up. US production + net imports falls a long way short of consumption which is the problem.
 
Last edited:
Quite happy with the way the POO is travelling uphill. No pointy stick needed.
Should see a decent rise tomorrow out of the ETF named OOO which is designed to follow the POO, as long as the cow on the left says MOO... ?

Screenshot_20210614-211255.png
 
Quite happy with the way the POO is travelling uphill. No pointy stick needed.
Should see a decent rise tomorrow out of the ETF named OOO which is designed to follow the POO, as long as the cow on the left says MOO... ?

View attachment 126038
Finally got some dividends from OOO.
The fund got really messy last year when the futures went negative.
As a ‘thematic emotional ETF investor’ I’m gonna stay in for another 3-6 month and see how it goes and then use my OOO capital losses against my other gains fir next FY.
Gunnerguy
 
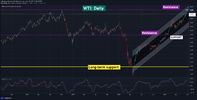
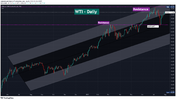
WTI is likely to meander sideways and down after news came out last night that OPEC is considering easing supply caps. Not a surprising outcome in that POO is at its highest price in almost 3 years, with long term resistance just $4 away:
wskSe0sI.png

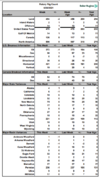
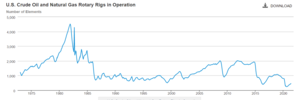
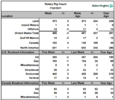
On the other hand, the North American rig count is not showing the US shale producers returning at the rate anticipated considering the POO.
Even more surprising is that Canada has been outpacing the USA in adding rigs over recent weeks:
1624923859581.png
 
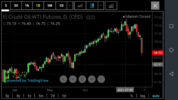
Big dump last night around 7+%
My theory is OPEC news (or lack of) was already priced in, so jitters have arisen from Delta variant numbers.
Boing dropped nearly 5% adding weight to this theory.

Not sure what, if any, correlation the USD has, but I suspect it added momentum.

Oil chart was getting ahead of itself by any account also.
Was out of all oil trades last week missing the highs of last Monday....grrr.

While it's very tempting to consider buying today after our markets dump, but I will be waiting for the chop to subside and bullish direction to reconfirm.

Thinking it may be a week to 4 weeks for this to occur, maybe more? but will want all the applicable indicators to confirm, or at least getting close to it.

Am expecting for OOO to pay a very decent 2nd half divvy around September, regardless of what happens with poo, so that is my future trade planned to capture the anticipated re rise.

Screenshot_20210720-083106.png
 
High probability of continuation as US drilling rigs are not flooding back to their oil patches at +$70bbl prices
It was enough to spur some action amongst the shalers though.
Poo not bouncing around as much as I had hoped though, but it's not pushing far from the 70 mark either.
Hoping I am positioned to be able to take advantage of any price plunging again below around the 68 mark.
 
It was enough to spur some action amongst the shalers though.
Probably should have put "some"
Reiterating that drilling rigs are not flooding back to shale oil
My comment was based off seeing a figure of 400% increase in shale something ?... I didn't clarify what, why etc my apologies

It may have been an increase of shale rigs, however if an increase of 1 rig was followed by 5 rigs, that's a 400% increase...impressive, but not!

Some explanation,
I am having issue with the data presentation by investing dot com.
In articles, it would seem data may be presented by a "machine" and data that is a rise is often shown as a red figure with arrow down etc.

The issues seem to be concentrated around negative figures,
ie; a previous negative goes further into negative and they present it as a positive, showing it as green with an up arrow.
True only in a mathematical sense, reality is opposite.
I should alert them to it, because it's just dumb and misleading...
 
such interesting mathematical quirks are not limited to oil data or Investing.com
Indeed, and as @peter2 has pointed out, many companies are reporting marvellous growth figures off the back of horrendous figures over the covid and or previous corresponding period.
Separating the wheat from the chaff becomes the issue.
 
So, it would seem new waves of covid ARE having an effect on the oil usage scenarios.
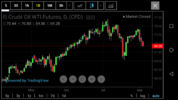
Watching this current downturn in poo closely...
A position opened up today, so will hold it open so as to be ready for entry back into OOO as that's the way I am trading oil, and as such, relying on the purported correlation and intention of the ETF. Trade intention (medium term up to 12 months) to catch a rise in SP as well as expected half previous financial year distribution. ?

Screenshot_20210804-230015.png
 
Hmmm also watching the downturn for a buy opportunity. Last price 62.25 USD. Looking at chart over last couple years makes me glad I don't use leverage. Given all the weirdness around this commodity, I doubt I could bring myself to buy any OOO for a long term contrarian position/gamble unless price is under 50 USD (and preferably well under).
 
Top