Australian (ASX) Stock Market Forum

New analysis technologies

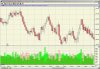
Time is convenient but often secondary to volume with respect to confirmation of price action, since price/time is generally underpinned by assumptions about volume/time.

Mean reversion occurs when price moves too fast for volume; demand temporarily outstrips supply, price corrects as supply recovers. This depends on the degree to which the market resembles imperfect competition - another interpretation of volume.

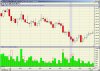
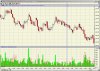
There are occasions when time will dictate price action, I think mostly on higher time frames, but for most situations I agree with volume > time.
 
Tech,

A lot of the software out of the states does this now. Including:

Ensign
Sierra Charts
Investor R/T
Market Delta
MultiCharts
NeoTicker
TradeMaven
TopGun
Tradestation (more via user-built ELDs than the in the software itself)
ESignal

I think Amibroker can do some of this stuff, but again driven by the users designing studies.

Some allow the user to customise the presentation more than others, some I am more familiar with than others. Some have free trials. Some are much more expensive than others, sometimes you get what you pay for, other times I am not sure. The ranking above is in no particular order.

This stuff can be done for any electronic market with a live data feed - different software allow for different feeds but an eSignal feed is common across all of them, as you would expect they seem ubiquitous. So, yes, equities can be presented in this way.

Something to be aware of in equities is the uptick rule can skew the volume at bid / offer numbers. Quite apart from the uptick rule the prevailing bias (both individually as well as the institutionalised bias such as the short-sale list) to go long over short will also skew volume results in equities.
 
Julius, thanks for that, thats important info.

And why do I feel like an icecream now?

---

Tech, sorry, further - it was the potential of the application of this stuff to VSA that got me excited about it initially. Motorway will have more to say, but I think its a no-brainer that the volume break-up is directly and immediately applicable to effort/result analysis...
 
Tim to me at least from the chart presented thats very clear in that where price stalls waiting volume gets filled.Chasing volume dries up.
 
OK, there seems to be a lot to discuss here regarding the use of using bars cut up by volume or range as opposed to time. I don’t think we have scratched the surface, but nevertheless, onwards.

What about cutting up the volume according to different measures?

The title of this thread is “new analysis technologies”, so can I introduce another new one (well, it was to me)?

The first chart attached to this post has volume posted below it, but volume presented in 3 ways. The bars are constant volume, in this case each bar is formed from the trading of 4,000 contracts. It is a quick-forming bar, and is of value for short-term trading. The first chart is a blow-up to explain the components of volume.

Now, because it is a constant volume bar, the volume for each price bar is the same, in this case 4,000.

The volume bar labelled “1”, and coloured the darker of the green, shows the amount of volume that traded at the offer price over the course of the bar forming. In the case of the bar labelled with the “1” this is about 3,200.

What is meant by trading at the offer is this is 3,200 contracts over the course of the bar where the buyers were “impatient” enough to jump in to buy at whatever the sellers were asking. I would refer to this as “aggressive” buying.

By implication, 800 contracts (4,000 minus 3,200) were bought by more patient buyers who had their bid hit. Also by implication, 800 contracts were sold by sellers impatient enough to sell at the bid (aggressive sellers), and also again by implication, 3,200 contracts were sold by sellers sitting patiently on the offer.

Anyone with an interest in VSA might be sitting up a little straighter in their chairs at this stage – in electronic markets the ability exists to see what the buyers and sellers are doing within each bar (at each price actually) in real time. The implications are not linear – “more aggressive buyers therefore I will buy too” is not necessarily a profitable tactic – but certainly they are interesting?

The lighter, or brighter colour green, labelled “2” in the first chart is the “aggressive” buying done by buyers trading 100 or more contracts in one hit – big, aggressive buyers. (Now, this needs to be monitored carefully, what if one buyer pays the offer for 150 contracts at one go, but the sellers are made up of a 20, 15, 25, 80, 5 and 5, I don’t know if this is reported as one trade of 150 or 6 trades of the amounts I detailed, I would love to hear more info on this).

The hollow red is the aggressive sellers, those sellers trading in hits of 100 or more. This is labelled “3”.

Of course these definitions of 100 or more are my definitions, you can choose whatever you wish. By the way, this stuff exists in many different softwares, I am not pushing any particular one.

OK, is this information of value, and if so how can you use this information? Well, that’s for you to answer, not for me to say. I am using it, but still haven’t settled on the one true approach (for me). Hence this thread, feedback appreciated.

Second chart attached shows the first 2 hours of regular trading hours of a 4000 volume constant bar chart, with volumes cut up as described.

Tim,

Wow, interesting stuff.

I must admit I wasn't aware of any software that could do this (volume bars).

Though I was excited at first impression (lol), I'm not quite convinced about the application of this analysis.

ie. is it just another tool to "confirm" price action.

But nevertheless, its definately worth looking into and I'll be following this discussion with interest.
 
Thanks Doc and Nizar re Amibroker. The link doc provided is for constant volume bars, range bars and tick bars. As far as I know Amibroker does not do the break-up of volume into aggressive buyers and sellers - yet. No doubt some of its users are working on that.

Nizar, your question "ie. is it just another tool to "confirm" price action" is a good one. Looking at the volume break-up it appears that an up bar is generally accompanied by more activity at the offer (aggressive buying), while a down bar is generally accompanied by more activity at the bid (aggressive selling). This makes sense, but it also puts this use of the volume at bid or offer into the category of a co-incident "indicator" (I don't think of volume as an indicator at all, but for the purpose of my point here, let's call it one). So, Nizar, it would appear that maybe it is just a confirming tool. But there is more to it than that, it is when it doesn't behave in concert with the price that its usefulness expands....
 
it is when it doesn't behave in concert with the price that its usefulness expands....

The central core I believe.
As examples

(1) Aggressive buyers/Sellers little/no increase in range (Either buying or selling climax)
(2) Increase in range no aggressive buyers or sellers ( look for a slowing/stop to the move)

Should be incorporated in Tradeguider.
I'll have a chat.
 
The central core I believe.
As examples

(1) Aggressive buyers/Sellers little/no increase in range (Either buying or selling climax)
(2) Increase in range no aggressive buyers or sellers ( look for a slowing/stop to the move)

Should be incorporated in Tradeguider.
I'll have a chat.

(1) I think this is spot on.
(2) This one I will watch for thanks Tech.
 
Just re-read this thread more thoroughly and it is fascinating.

I don't have much knowledge of this kind of tech analysis, other than my own observations from my study of economics.

In my opinion, TIME is an arbitary division of price: price is not dictated by time, but rather by volume. The quantities that are demanded and supplied by market participants faciliate shifts in equilibrium or demand/supply balance.

Assessment of market 'imperfection' allow us to draw conclusions about the stability of shifts in market price. 'Perfect competition' describes a market where no individual buyer or seller is able to influence market price: of course this situation is a purely theoretical - all markets resemble imperfect competition to some degree. Imperfection is characterised by liquidity, depth, market impact, etc.

These market characteristics are dynamic; the number of participants (bid / offer) varies day by day and this gives rise to situations where buyers can outweigh sellers ( or vice-versa) and a market can become 'overbought' or 'oversold'. Other times volume might precede a shift in price, etc ,etc.

Price with respect to volume is more relevent to some markets than others, same goes for range bars, I think for the same reasons as above.

It's a very interesting area, would like to hear more from others (tim,mw,tech) who have more experience in this area.
 
Hi Julius, good to see this thread brought back to life!


“I don't have much knowledge of this kind of tech analysis, other than my own observations from my study of economics.”

This kind of analysis is new to me too, using volume bars, range bars etc. instead of time-based bars and using the break-up of volume into volume dealt at the bid and volume dealt at the offer. I think some of the traditional ideas of technical analysis can be applied to this stuff, but with modifications; but to be honest I think using your own observations is going to be even better; and I think a background in economics is a great advantage.

Using OHLC bars based on divisions of time is the method that technical analysis has grown up using. There is a vast store of knowledge built up around time-based bars and I will not dismiss all of this knowledge. I have a bias about what sort of analysis I prefer, I think everyone does; for me it is Wyckoff-type analysis as opposed to using indicators. I don’t pretend to be an expert and I really look forward to posts by Motorway – has taught me a lot. A subset of Wyckoff is the VSA analysis, and we are lucky to have the posts of Tech/a to learn from. VSA, for me, is a difficult art; I think partially because it uses time-based bars and reconciles changes in volume, changes in range (high minus low), and changes in the last price on the bar all within the “background”, or context, or wave, within which the bar forms. It’s a challenging task.

This is where I think some of these new presentations of the data can be helpful, at least to me. A constant volume bar, by its definition, holds volume at a fixed level, while allowing the range and the “closing” price to vary (and time to vary also). I think there is scope to develop an analysis of the wave formed from constant volume bars. Wyckoff states that a wave will persist as long as it can attract a following; using constant volume bars shows the level/volume of that following in a consistent format.

Of course, there are range bars too – where the volume and “close” vary only (and time). There is scope to develop an analysis technique here too.

While I am not a big fan of technical indicators I think many of them can be improved by using these different bar types. For example, the RSI (I only picked the RSI because I have a soft spot for it) measures the difference in the close price between successive bars over some time period; the default period used is 14 time periods (days, hours, whatever). One of its weaknesses is the close price may move higher on very low volume, but this movement will be counted as equal to a close price movement on high volume. I would have thought the high volume movement would be of more relevance to the calculation, but it is treated as equal to a low volume movement. But lets instead calculate the RSI using constant volume bars, here each “close” price is taken after “x” number of shares/contracts has traded, not each time some “x” period of time has passed. I haven’t done any comparison between the two methods, as I say indicators are not really my thing, but I would have thought there is fertile ground for research and developing methods here.

Of more interest to me is the bid/offer volume analysis – combining this with constant volume bars and/or range bars can give some great insights into what is going on. One thing that struck me very strongly with this break-up of the volume is the extent to which the price is driven by volume, most times by aggressive volume but, tellingly, sometimes by the passive side of the volume, I guess it is something I always knew was true but to see it so clearly demonstrated has given me a new perspective. And also recognising when volume is driven by price, the flip side of the relationship.

Having said all this I wouldn’t discount existing forms of chart presentations and analysis. Hunt down Motorway’s posts on point and figure charts, on the ASF forum and others, there is great value to be found in these charts too.
 
Below is a 3-minute chart (each candle is 3 minutes of market activity) and a 5000 contract constant volume (each candle is 5000 contracts). The two charts represent approximately the same time, the first two or so hours of RTH on the ES Z7 on Friday Nov.30.

Comparing the two charts will show similarities and differences. The most important similarity is they both show where the support and resistance forms. This is critical, IMO, and raises the question of what value then does a constant volume bar chart add? Good question I think.

Differences - no volume histogram on the 5000V chart - each candle is the same volume. There are more bars on the 5000V chart for any time period - this is a function of the activity in the market, in a contract or equity with less volume there could be more 3-minute (or whatever time period) bars formed than 5000V bars.

The Constant Volume chart I have heard referred to as a "momentum" chart, or "Momentum bars" - interesting nomenclature and I think it makes sense. If each bar forms with the same volume, then the relationships between the high, low, open and close of each bar, and the relationship between bars, gives a perspective of where the momentum is in the market.
 

Attachments

  • 1. 3 min.jpg
    1. 3 min.jpg
    98 KB · Views: 91
  • 1. 5000 V.jpg
    1. 5000 V.jpg
    79.5 KB · Views: 90
This chart shows the 5000V chart for the first hour of the above contract with the "buy" and "sell" volume histogram; the green volume bars are "buy" volume (volume dealt at the asking price) and the hollow red volume bars are the "sell" volume (volume dealt at the bid price).

Quality of image is not great but I think its readable.
 

Attachments

  • 2. 5000 Vol.jpg
    2. 5000 Vol.jpg
    107.3 KB · Views: 87
For completeness, here is the 3 minute chart with the buy/sell volume histogram below.
 

Attachments

  • 2. 3min.jpg
    2. 3min.jpg
    103 KB · Views: 87
And below is a 1-minute chart with the buy/sell volume histogram, this might be a better comparison with the 5000V bars.

Any comments/questions/ideas gratefully received.
 

Attachments

  • 3. 1 min.jpg
    3. 1 min.jpg
    114.6 KB · Views: 84
The Constant Volume chart I have heard referred to as a "momentum" chart, or "Momentum bars"


Momentum bars Document Type and Number:United States Patent 20040030623 http://www.freepatentsonline.com/20040030623.html

Abstract:An improved method and system for displaying financial information using a computer is disclosed. A technical analyst chooses a user defined range of data to study and displays the user defined range of data comprising indicia of four transaction prices along a y-axis. The display of the user defined range of data changes only when a transaction price appears outside the user defined range of data. The x-axis comprises a time independent variable in order to discount price distribution patterns that evidence little change, systematize patterns that reveal large changes, and display patterns in a simplified visual summary that reveal when the market is in genuine distribution and development.


And halfway down this page

http://www.ensignsoftware.com/tips/tradingtips49.htm

Trading Tip:
Momentum Bars
by Howard Arrington
Two articles in the Stocks, Futures & Options magazine (www.sfomag.com) introduced a new charting concept. The first article was 'Paradigm Shift Lights the Way to Momentum Bars' by Desmond MacRae, SFO Feb 2003. The follow-up article was 'Momentum Bars: The Sequel ...' by Desmond MacRae, SFO Apr 2003. These articles describe a charting concept developed by Danton Long called Momentum Bars.

Momentum Bars are basically constant range bars. The bars look like standard chart bars with an open, high, low, close and volume. The high-low range of each bar is constant. A new bar does not start until a price tick is received that would exceed the fixed range of the current bar. Momentum Bar charts have the following characteristics:

Each bar is the same height because the range is constant.
The close of a bar is always at the high or low of the bar.
The open of a bar is always one tick below or above the close of the preceding bar.
The time period covered by each bar varies.
All gaps are filled with inserted 'phantom' bars.


I don't have much knowledge of this kind of tech analysis, other than my own observations from my study of economics.

julius here are somthings that I have taken a little note of


Cobweb Theory + Problem of adverse slelection + winners curse

are some economic observations that would underpin a technical approach to markets

THE BASICS OF COBWEB THEORY
Three tenets of cobweb theory need to be understood. First,
there is the idea of “anchoring,” which means that expectations
of future prices are heavily influenced by recent extreme
prices. Because of the uncertainty about future price direction,
price estimation is based on overconservative assessments of
how they are likely to change with time. Often, it is simply
assumed that recent extreme price levels represent
levels obtainable in the future.

(So this is Support and Resistance )

The second idea is that there are both
efficient and inefficient sources of a given
commodity.

( Strong and Weak hands , eg impossible to buy from a strong hand, easy to buy off a weak hand )

This second tenet of (linear) cobweb theory is that
supply curves will have a linear price/quantity-supplied variation,
with price increasing as quantity increases. ( only way to get strong hands to sell )

The third and final idea is that the lower the price of
something, the more of it will be sold.

( Best way to get weak hands to sell )

Problem of adverse selection ( Or information is really valuable )

When a trading opportunity is presented to a group of traders, Those who accept are on average less smart

( eg it is the lemons that seem ( are made ) attractive to buy . The good uns are not offered for sale)


winners curse

At any time the final winning bid often exceeds true value

( All those breakouts that are bad buys , upthrusts etc )

Just a few things that make economics relevant

as Timmy says identifying support and resistance is one of the most important things to do .

Momentum then is an important measure of the changes in support and resistance .....These changes allow one to anticipate and confirm ..

momentum ( and volume ) reveal how supportive and how resistive
Buying pressure and selling pressure are and how they are changing..

The actual levels that they become active reveal demand and supply unfolding ( trends )

Cobweb theory focuses on patterns of contracting and expanding volatility
That lead to turning points....


A price volume vs time chart in a Wyckoff sense is an effort vs result chart
A Price (volume) non linear chart is a cause and effect chart...

This could suggest what uses the charts best have...
Tim I just see you have added some charts since I have been writing:)

Look at the buy vol on the 1 min chart ( the largest green )
If I understand Your chart that was ( dumb ? ) buy volume ?

Adverse selection + winners curse :)

Support and resistance , Strong and Weak hands
motorway
 
Comparing the two charts will show similarities and differences. The most important similarity is they both show where the support and resistance forms. This is critical, IMO, and raises the question of what value then does a constant volume bar chart add? Good question I think.

Differences - no volume histogram on the 5000V chart - each candle is the same volume. There are more bars on the 5000V chart for any time period - this is a function of the activity in the market, in a contract or equity with less volume there could be more 3-minute (or whatever time period) bars formed than 5000V bars.

Here are Some Richard Wyckoff comments that might be of interest
charts are either linear or non linear with respect to time
Just read non linear where Figure chart is used.

motorway

The most valuable feature of Figure Charts, however, is their
horizontal formations,
It is in these horizontal formations, or congestion areas that we find the greatest aid
For example the figure chart may show many fluctuations on the
full figures, while the verticals are unchanged. For these reasons it is vital to keep both forms of
charts.

full figures refers to the filter
what range ( with volume bars ) what volume

the changing speeds are an indication of the changing importance of support and resistance ....

changes relative to the time based bars

(a) in determining how
far a stock should go; (b) when it meets opposition, viz., when it
has about reached the end of its move; and with the help of the
vertical chart (c) determining the trend, and (d) when a stock is on
the springboard.


There would be fewer momentum bars( constant range bars ( much like P&F ) )
In a congestion zone compared to constant time based bars

All indicators should work better with CRB than with CTB
with clearer signals and less whip saws

That is if you want to use indicators ;)

Support and resistance

is not the same either ( hence trend lines )

The constant speed on the CTB chart
can take the price series through support resistance zones
and more obviously through trend lines

The movement on a CRB chart is a real cause
likely to have an effect...

Compare the clarity of trends , trend lines
hence support resistance
on your CRB and CVB charts
compared to CTB charts

CRB constant Range Bars
CVB constant volume bars

using something other than time as filter
show price movements have a structure irrespective of time frame ,motorway

CTB constant time bars .. are esp important when the volume shows them to be important .....effort Vs result.....VSA ?

problem of periodicity of a price series ( cobweb ? )

All aspects of Wyckoff method

P&F might still be the best non linear chart
columns are neither constant price, volume or time:)
adaptive is real

P&F chart is almost a constant nothing
no limits on how many columns or how long the columns

When We can use log box sizes then scalable across any price range and any instrument
ferreting out the largest ""cause"

and with the help of the
vertical chart (c) determining the trend, and (d) when a stock is on
the springboard.

as well..


motorway
 
Wow! Thanks Motorway - there is heaps to work through there.

I have attached a 1 point constant range bar chart below, with the volume break-up and also total volume in grey behind.

I have also attached a 1 point box size (4 tics) by 1 box reversal, also with volume break-up histogram below. This maybe not a fine enough detail chart compared to the other charts I have posted today, so I attached an 0.5 point (2 tics) x 1 box reversal, as two charts, one covering the first hour, the next covering the following hour - it is a fine-grained chart.

These should provide some good comparison and hopefully future discussion of the points you have raised.
 

Attachments

  • 4. rge 1 pt.jpg
    4. rge 1 pt.jpg
    110.3 KB · Views: 75
  • 4. pf 1 point.jpg
    4. pf 1 point.jpg
    146.4 KB · Views: 76
  • 4.jpg
    4.jpg
    146 KB · Views: 74
  • 4. 2.jpg
    4. 2.jpg
    150.2 KB · Views: 74
more later
But what should stick out
is clear trend
and a clear periodicity ( an aspect of support and resistance )

contraction and expansion ( dead centre, springboard , turning points)

motorway
 
Top