- Joined
- 25 July 2021
- Posts
- 874
- Reactions
- 2,214
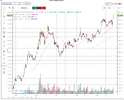
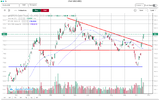
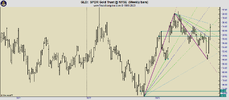
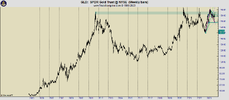
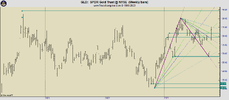
From a technical standpoint GLD is now at an important level. On the weekly chart below it can be seen that GLD has now reached the 50% time&price fib (blue line) and is just under a price resistance zone. It still has work to do before confirming a continuation of a long term up trend, so far it only qualifies as a good bounce in a down trend.
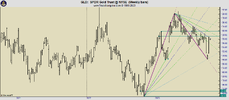
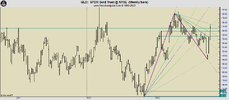
If I add the forty week MA to the chart you can see that GLD is still trading below the 50 day MA which is generally considered the line in the sand for market trend.
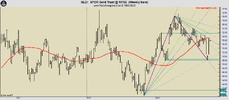

If I add the forty week MA to the chart you can see that GLD is still trading below the 50 day MA which is generally considered the line in the sand for market trend.


