Australian (ASX) Stock Market Forum

Gold Price - Where is it heading?

Here is another look at the GLD chart showing strength in the Gold market from another point of view. The Balance of Power indicator, introduced by Igor Livshin, measures the market strength of buyers against sellers by assessing the ability of each side to drive prices to an extreme level.
1645095404850.png
 
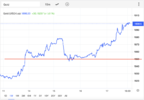
JP Morgan have finally let POG poke through 1850 ish and test that level to move higher above. Shorts may have been unbuttoned.

There should be a number of TAs out there posting up breakout articles today with potential targets on the giant C&H. The left hand edge of the cup needs to be broken first though. Plenty will be getting set for it though, if not already.

Screen Shot 2022-02-18 at 7.28.08 am.pngScreen Shot 2022-02-18 at 7.27.18 am.png
 
Last edited:
I like talk of a Cup and Handle here. But, not sure where and when the handle ends. Going to be interesting.
This is a hard one to chart as a C&H calc Sean.

Will our AUD Gold price reach $3,000 per oz !? Hope so...

I don't think so Telamelo, not quite.

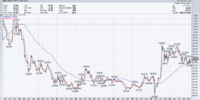
Can anyone here put up a monthly Gold chart please - share their analysis/thoughts about it ?
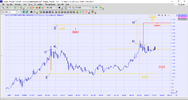
For what it is worth, it is quite a hard one to chart and I have given a few potential price outcomes and how they were calculated to think about on a monthly chart.

Gold monthly swing trade 20.2.2022.png
 
Monthly Gold chart apparently shows a huge cup & handle formation taken place... read that forecast gold price target is US$2,800 (from this cup & handle formation)

Can anyone here put up a monthly Gold chart please - share their analysis/thoughts about it ?
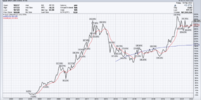
Screen Shot 2022-02-20 at 3.44.37 PM.png

More about the fundamental narrative than any technical pattern, although the technical pattern supports the fundamental narrative which is: The Fed cannot raise the FFR above the inflation rate, which would need to be at 8%.

In fact, it is highly likely that the S&P500 will blow up at an FFR of 2%. When I say blow up, a decline of about 30%. Currently down 8%.

Should the S&P500 decline to +/- that level, it is again highly likely that the Fed will reinstitute QE. The issue then becomes whether DXY survives.

If the Fed does not underpin the market with further QE, then the market continues lower to about (-80%) in a deflationary bust, circa the 1929 - 1933 era.

Postulated is a debt Jubilee.

If that were the case, then any new currency would likely need to be backed with a hard asset (take your pick). Given that most CB's hold some or lots of gold, gold is likely beneficiary for a revaluation.

Therefore, very bullish.

jog on
duc
 
I've seen numerous TA practitioners come up with the same target from the C&H, Ann. Same target as yours between 2500-2700. There's been so many I hope it just becomes a self fulfilling prophecy. So, let's spread the word - USD$2700 gold. :)
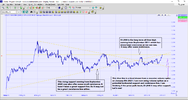
And with the $AUD possibly at $USD0.64 due to commodity surge makes gold $AUD4200 or if at todays rate $AUD3760 from it's present AUD$2650/USD$1900

:)

gg
 
@Sean K, let's look at this a bit closer. On the daily chart, I can see a couple of weak resistance lines which may cause a moment of pause for the POG. I am now using volume spikes as a level from the EOD price of the VS. I am looking to see if they will offer support or resistance. I have been working on this solidly for a couple of weeks now and I feel pretty confident they are a genuine level of support or resistance. I have drawn a line from the price level of $1,848 coming from January 2021. Let's see if this offers some support should the POG fall back.

Gold volume spike 20.2.2022.png
 
@Sean K, let's look at this a bit closer. On the daily chart, I can see a couple of weak resistance lines which may cause a moment of pause for the POG. I am now using volume spikes as a level from the EOD price of the VS. I am looking to see if they will offer support or resistance. I have been working on this solidly for a couple of weeks now and I feel pretty confident they are a genuine level of support or resistance. I have drawn a line from the price level of $1,848 coming from January 2021. Let's see if this offers some support should the POG fall back.

View attachment 137839
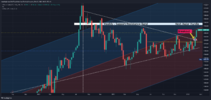
It looks like you're using @Garpal Gumnut 's diagonal upper resistance line with the break up in Nov 21. I've done my line starting from Nov 20 and disregarded the blow of top in Aug 20, so my break point was 1850. Agree, 1900 a very important line here. If we can break that on a weekly chart would be very bullish. Still overall looks like 30 Sep bottom was the start of the way back up.

 
My take on the next hurdle, charted weekly:
1645347178308.png
Ideally if POG can hit $1930 and quickly move through $1940 then we are off to another record high later this year.
The maroon/dark blue shaded area is the regression trend from the bull run commencing late 2016; August 2020's record high was a clear outlier.
 
It's actually easier to see what is happening in the gold market via the silver market because the gold market is dominated by the physical aspect of the market rather than the paper market. Central Banks put a level on the physical market that it will not fall below before they come in buying by the tonne. China, Russia, etc.

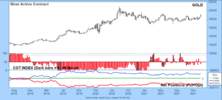
Here is the gold paper market:

Screen Shot 2022-02-21 at 5.45.27 AM.png

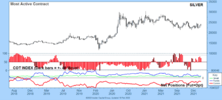
The silver paper market:

Screen Shot 2022-02-21 at 5.56.05 AM.png

The paper market is bullish. Rising OI and falling net short positions. Which means the commercials are getting long.

The commercials are now required to be hedged in the physical market via Basel III. No more paper hedging paper. Premiums in the physical are blowing out as there is a definite shortage of physical. The paper markets are in backwardation. By pretty significant amounts as well, which is risky as it provides an arbitrage with spot. However, that is just how tight the physical markets have become, squeezing the shorts hard.

BAC is stuck in an 800 million ounce short position in the paper (inherited from JPM) that they are trying to work out of. They cannot deliver on an 800 million ounce position. They can only hedge the position with physical by transferring it from the SLV ETF via Bank of New York, Mellon and the Trustee who provide consent. This is not deliverable...it can only be used as short term collateral as it is an unallocated physical position in SLV. You cannot buy an 800 million ounces until late this year/next year. All gone for that sort of size anyway.

Short story: silver is bullish because silver follows gold in the early stages of a bull market. Therefore gold is in a bull market because silver is currently very bullish. It is hard to see gold, far easier to see silver.

Screen Shot 2022-02-21 at 6.16.25 AM.png


jog on
duc
 
Top