Australian (ASX) Stock Market Forum

Futures trading journal - GB

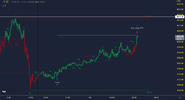
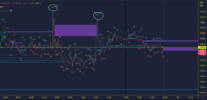
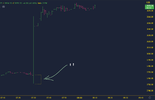
54 ticks of pure market manipulation seconds before the news is released. Try to explain that 54 tick dump some other way - it can't be done. It's cheating,... on a big scale.

The people who run the world, also run the markets. They know everything ahead of time, because they actually plan it. "Run it down and grab that liquidity". They use the news, wars and politics to give "justification" to the moves that play out. The whole thing is rigged. Luckliy for us, they leave footprints in the charts.

This is not an exception - it happens all the time.

x.png
 
What about the news itself? I tend to think it's all rigged.

Take the CPI figures. Can you check them yourself? Nope. Can you put in a FOI request to see the raw data? I doubt it. If you even got hold of the raw data, would you know what to do with it? I wouldn't know where to start! And who checks on the people who hand down the final figure? Anyone? We'll never know the answer to that question. Essentially, they are free to make up whatever number they like in order to move the market towards their next pre-determined level. And I believe this is exactly what happens. Wherever large sums of money are flowing, there will be big boys with their snouts in the trough, manipulating the game.

Reminds me of the recent flood relief package the govt organized. This one was eventually checked, but only because the amount of money that was flowing out of govt coffers was many, many times above what was expected. Turns out some crooks were submitting blank application forms and getting approved for govt payments. Yep - blank forms.

So whenever I hear the news, I take it with several grains of salt. Big players have used the media for their own ends since.... probably about the 1930's (?) or so. A long time, anyway. It works so well because most people believe what they see and hear on the news.

Unemployment is down 2%! Really? Just before an election? Petrol prices set to rise due to supply chain concerns. Really?

Always ask: Cui bono?
 
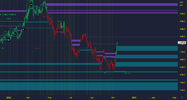
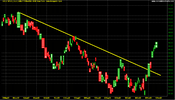
Gold entering overbought, and there's a huge amount of buying imbalance in the last week, on all TFs (thick blue lines). That will need rebalancing.

I don't know what drives metals prices. But technically, I think the max upside for this swing would be 1800. Probably will retreat b4 that.

x.png
 
Just realized all this talk of manipulation doesn't serve me. I must stop that - it's a bad habit.

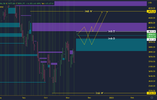
Some potential paths for ES. No trades at present.

x.png
 
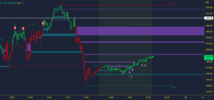
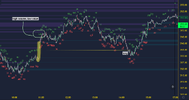
Long ES. The system has a dynamic target and a fixed target of 0.75%. Fixed target is visible as the green horiz line. Finally got that plotted (thanks for the reminder ;)). The stop is just under 3900.

Hope I can trade this for real one day soon. Would be nice to get off my L-plates after so many failed attempts to trade indices.

x.png
 
1 & 4 hr chart to establish HTF trend.
Cumulative volume swings on the 5 min - check if this alings with the HTF trend.
Volume profile to find low value areas. POC/value zones are not useful as far as I can tell.
 
ES has been behaving for this style of system.

High volume swing - bulls in control. Low value area indicates imbalance which will be revisited, but defended, providing long entry opportunity.

x.png
 
54 ticks of pure market manipulation seconds before the news is released. Try to explain that 54 tick dump some other way - it can't be done. It's cheating,... on a big scale.

The people who run the world, also run the markets. They know everything ahead of time, because they actually plan it. "Run it down and grab that liquidity". They use the news, wars and politics to give "justification" to the moves that play out. The whole thing is rigged. Luckliy for us, they leave footprints in the charts.

This is not an exception - it happens all the time.


View attachment 149045

Get your head out of the chart.

Before big news, participants withdraw liquidity, retail market orders stupid enough to trade in those moments gets weird fills. Some win, some lose.

It's not manipulation.
 
Some backtests.

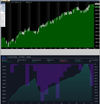
ES, 5 min, 1 contract, brokerage $5, no slippage.

Top pic: Approx 4 months, in sample.
Bottom pic: 1 month, out-of-sample.

The metrics of the OOS are roughly lining up with the IS. Similar shape, similar WR and max DD. I wouldn't want too many losing trades in a row however. Feels like it could blow up if that happened.

x.png
 
Top