Australian (ASX) Stock Market Forum

Futures trading journal - GB

Murray Maths lines are worth a look.

Buy below level 4, sell above level 5. Can get some very good signals on 1 min ES.
 
I meant 15 min.

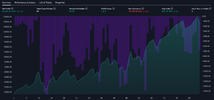
This is basic, using MM lines, buy below level 4, sell above level 5. Fixed stops & targets. Sept 2022 to present. 5 contracts.


x.png
 
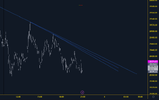
ES looking good. Trendlines give very reliable indications of health. Weakness indicated by an approach but falling back without touching. Neutral strength when it touches then reverses. Now it travels a long distance to reach and move straight through the line. So even if it pulls back, the target has a decent chance of meeting the upside target.


x.png
 
Being able to lose without painful emotion. That's the key, I think.

Of course one can block painful emotion, but that's not the same thing. Instead, fully feeling emotion and allowing it to do its thing in the body. Doing this repeatedly to the point that one can maintain equanimity with each loss.
That is only if you are Paper Trading
 
Being able to lose without painful emotion. That's the key, I think.

Of course one can block painful emotion, but that's not the same thing. Instead, fully feeling emotion and allowing it to do its thing in the body. Doing this repeatedly to the point that one can maintain equanimity with each loss.
Crude up last night..........also came across an article in the night, not sure what bearing this has............

Oil Change​

After years of wrangling, the world’s most important oil price is about to be transformed for good, allowing crude supplies from west Texas to help determine the price of millions of barrels a day of petroleum transactions.

The shift is because the existing benchmark, Dated Brent, is slowly running out of tradable oil for it to remain reliable. As such, its publisher S&P Global Commodity Insights — better known by traders as Platts — has been forced to make a dramatic overhaul.

From cargoes for June onward, West Texas Intermediate Midland, oil from the Permian will become one of a handful of grades that set the Dated benchmark. Here’s why that matters.
I keep seeing news about the petro-dollar. I don't understand it, but it will mean lots of volatility.

ES looks exhausted right now and prob needs to correct a bit.
 
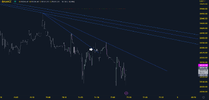
BTC trendline weakness, as successive peaks pull down further from the initial trendline. 1 min.

The weakness might only last another 15 mins, but imo it's not a time to buy when this pattern appears.

x.png
 
There's been one trendline breakout, but not supported by volume, so not a buy. It slows the downwards momentum only slightly. The trendlines continue to pile up as it cascades downwards. If it continues to cascade downwards, stopping volume will come in and create a V-bottom. So I'll watch for a volume spike and a lower wick crossing the lower Murray Math line. The math lines are just simple volatility bands like Bollingers, only better.

x.png
 
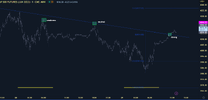
There it is. The last green triangle has the volume, so I'd buy at 28,186 and see how it behaves as it approaches the first overhead trendline. Stop below the most recent low.

x.png
 
It's going up, but the move is weak. Will sell when it gets to the trendline... or perhaps sooner if it rolls over.

edit: good buying just now. Won't sell at trendline, but expecting a pause when it reaches it. Target 28,359.
 
There was no pause which gives me confidence. It's now gone 90% towards my target but this is common with trendline targets. It's retracing but no reason to sell. It may even retrace quite a bit but there's enough strength to hold on for now.

If I'm able to sell at my target (looks likely as a pennant is forming), then I will probably re-buy on a retrace to 28264, and ride it all the way up to 28600 (approx).
 
3 touch trendlines are rare. A perfect one has formed on the 1 min chart. They will use this to trap bulls... but it can be traded!

x.png
 
3 touch trendlines are rare. A perfect one has formed on the 1 min chart. They will use this to trap bulls... but it can be traded!

View attachment 155381
The trendline didn't get broken last night.

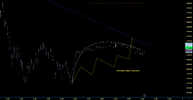
Right now it's being approached but it's trying to avoid it. A weak approach with soft buying pressure. For it to breakout and run up, the approach should be accelerating with strong volume support.

There's still a chance it may rip up through the line from here and form what bulkowski calls an inverted ascending scallop pattern. So watching for that too.

x.png
 
Top