Australian (ASX) Stock Market Forum

Futures trading journal - GB

Obviously got that wrong. The pattern over several hours was something I hadn't seen before, and I thought I'd take a guess.

It was sideways movement with consistent selling, interspersed with 20 or so strong buying candles (more than usual - 6 is a lot). But no medium strength buying. Sort of like sell, sell, sell, sell, sell, sell, BUY, sell, sell, sell, sell, BUY.
Maybe I was just a day early with that observation. Need to keep this in mind for next time. Markets are certainly dumping now.
 
Obviously got that wrong. The pattern over several hours was something I hadn't seen before, and I thought I'd take a guess.

It was sideways movement with consistent selling, interspersed with 20 or so strong buying candles (more than usual - 6 is a lot). But no medium strength buying. Sort of like sell, sell, sell, sell, sell, sell, BUY, sell, sell, sell, sell, BUY.
I suspected that when I saw the way gold traded (can't remember which day and too lazy to dig it up on the gold thread)..........buy, sell, buy, sell, spiking up and down like I'd never seen. (maybe it did happen but I didn't see it before) Spent all afternoon watching it and forgot about everything else........ with all that volatility, the share prices went up........must have been gearing up for a big dump last night. Yeah, must remember this for the future, GB.
 
I suspected that when I saw the way gold traded (can't remember which day and too lazy to dig it up on the gold thread)..........buy, sell, buy, sell, spiking up and down like I'd never seen. (maybe it did happen but I didn't see it before) Spent all afternoon watching it and forgot about everything else........ with all that volatility, the share prices went up........must have been gearing up for a big dump last night. Yeah, must remember this for the future, GB.

Good on you esky. The clues can by very tiny, but if repeating++, they probably mean something.

Gold now bouncing off major supports in the daily and weekly imbalance zones. Has a bit further to go up.

Daily.

x.png
 
Obviously got that wrong. The pattern over several hours was something I hadn't seen before, and I thought I'd take a guess.

It was sideways movement with consistent selling, interspersed with 20 or so strong buying candles (more than usual - 6 is a lot). But no medium strength buying. Sort of like sell, sell, sell, sell, sell, sell, BUY, sell, sell, sell, sell, BUY.
Saw a bit of this^^ again in the last few hours. Sideways price movement, with intermttent, single, strong up candles amid slow waves of sellings. So let's see if it does the pump first then dump, or just straight into the dump.

"He's losing his mind... and I'm reaping all the benefits". John Lovitz, Wedding Singer.
 
can you elaborate? how can volume be important without price?
I only said it was more important, not that it could be a standalone indicator.

A random stock's volume below. All we know is when the price becomes highly volatile. At the highest point in the volume there will likely be a major turning point in price. But you can't tell that turning point until well after the fact. On a smaller TF, you can see when the volume begins to become ineffective at moving the price upwards.


x.png
 
Regardless of the system and its signals, profits & losses always match the inner feeling. There's a certain 'place' where you know you're in the zone and your trades will win. Accessing that feeling is majority of the work. I've found I can work on this in demo mode, which is great. My system is good enough. Will probably find new ways to use it, but it's pretty much done.

I'm taking a long time with this because I want it know I'm mentally ready. It's not going to be a 'side hustle'.
 
Racing cars are light weight so that they react immediately. They're lower to the ground and have hard suspension so that you can feel every little stone. Trading indicators should react immediately to price and let you feel every single transaction that happens.
 
Gold sitting on monthly imbalance. I'd be surprised if it doesn't provide support. Looking for reversal patterns and long.

weekly chart.

x.png
 
Trendlines are highly reliable, especially on the oil chart. Composite Man uses the breakout to draw in buyers.

Trendines are a good way to reference time in your system.
 
Gold sitting on monthly imbalance. I'd be surprised if it doesn't provide support. Looking for reversal patterns and long.

weekly chart.

View attachment 153016
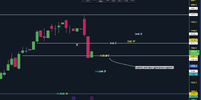
Made an effort to come up off the monthly imbalance zone, but it's pretty weak. So it will either collect liquidity at this level for some time or break down through it to the weekly imbalance way down around 1794! Would be unusual for a monthly imbalance not to provide a 50% retrace opportunity.

Now retesting the weak breakout. Expecting it to flop.

5 min
x.png
 
There's lots of clues in failed buy signals. Say you buy and it starts to fall. Scale in x1 at: buyprice - (target - buyprice). This often allows you to exit 2 contracts at break even. Depends on what sort of target you're using, obviously.
 
Top