Australian (ASX) Stock Market Forum

Dump it Here

Woolworths Price Chart (WOW)
For this series of posts, I’ll focus on Woolworths (WOW) because it’s a company most people are familiar with, having shopped there without ever considering how each dollar moves through the company. Many don’t even care about these details. However, looking at the chart and the price fluctuations, it’s hard for beginners to understand what drives these daily movements.

To them, Woolworths today looks the same as yesterday. While the reasons behind these movements might not seem important, capturing these movements is crucial. Buying at the right time and selling at the right time is critical to making money - it’s the name of the game.
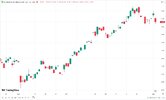
##1. Woolworth (WOW) Price Chart.jpg


Skate.
 
@Richard Dale, I appreciate your enthusiasm and critical analysis in this thread. However, your posts should be constructive. To ensure we all benefit from this discussion, I encourage you to share your insights and experiences in a way that others can learn from. Being respectful and actively participating is crucial in making this thread a valuable resource for everyone. Regarding your mention of the "universe" could you please elaborate on what you mean by this term? I’m interested in understanding your perspective.

Skate.
I normally don't talk smack at other or being subjective or even judge mental to other trading system. I remember there is a wise words that said " If you can't stand on the heat don't work at the kitchen". Following this statement, somehow I believe Richard is right and I felt your post politely to tell people to shut up when they are disagree with you. Remember, You are the one who ask people opinions and since you are the first to request "others" to comments. you need to take their opinions.

There are a view main points and this is my own personal opinion regarding your post.

1. Why bother to develop a TS that is only trade the top 20? If you got a good trading system especially LE only; then this will predominantly work for the whole asset classes in ASX. And looking at your "cherry picking" stock test candidate ? Don't you think this is so bias? So, your TS is similar to my analogy i.e. if you got Lamborghini you can only drive at a certain road and at a certain time frame and 1 condition. Don't you think this is weird and weak?
Secondly, are you trying to compete with "someone who has a momentum strategy for blue chip only?"

2.You provides a buy and sell signal. there is one minor point that you need to consider

* This is a half developed signal ! I can see you still tweaking parameters, asking people opinions to contribute for your own trading system without providing a clear parameters or even a simulated report. And to add up Rich' comment; I saw that only common info being shared and there was no code being given?) This is also the reason why I don't even bother to spend too much time on this .

3. . Everybody over this forum know how to trade and got their own ammo. I don't see rich' post is disrespectful in fact, I find a few offensive words from your part if you flip back a view posts. So, please be relax, be humble and a bit of sense of humility. No one is a senior or guru.
 
Regarding your mention of the "universe" could you please elaborate on what you mean by this term? I’m interested in understanding your perspective.

I already stated this:

I guess you don't understand by what I mean by "universe" so I'll try and explain this to you further.

What are your rules for your candidate stocks for your strategy? Are these rules consistently applied for backtesting?


For futher clarification since you're you've yet to answer it:
What are your candidate stocks? Stocks taken from the top 100? Stocks taken from All Ords? Random selection? Stocks selected because the chart "looks good?" State your exact criteria for inclusion/exclusion. This is a fairly basic step of systematic trading.
 
Hey, let's start a system (and continue posting about it) when the market is trending up. This is complete FIGJAM.

@bettamania, thank you for your comments.

First off, this is a discussion thread, and members are encouraged to join in the discussion. While we may disagree, being polite to others is always my intention. I have never told anyone to “shut up” when they disagree with my point of view. It is also incorrect to state that I requested the opinions of others - "that is simply not true".

I welcome comments and opinions from other members because that is how we learn - by bouncing ideas around. I certainly value their opinions and make a habit of responding to posts to show interest in what others have to say. Expressing alternative views is the very nature of this thread. All I ask is for others to post politely and focus on the point, not the person. Stating that my posts are complete "FIGJAM" isn’t a nice way to encourage further conversation, and I believe you may have overlooked that.

Regarding why I developed a trading system that only trades the top 20 stocks, this will become clearer after I finish my series of posts about the “Signal Generator” today. This is a beginner’s thread, and beginners often don’t know where to start or what questions to ask, which is why I post.

By the way, the 20/10 positions were not cherry-picked, rather, I used the same companies as in a previous exercise, “The 20-ASX Investment Strategy.”

I’m not competing with anyone, I’m presenting a simple trading idea for beginners to get a foothold in the world of system trading.

You are correct that I have taken advice from others and tweaked the “Original Signal Generator” to incorporate those suggestions, which improved the system results immensely. I renamed that system "Enhanced Signal Generator”.

Reporting on the “Enhanced Signal Generator” has now ceased because a member mentioned that posting excessive information was becoming overwhelming. Therefore, I ceased reporting on its progress, as the performance or profitability was never the point of the exercise, rather, it was about following the process.

Skate.
 
Looking at the Price Chart of (WOW)
How do we go about capturing the price movements of (WOW)?

When we look at a chart, we’re essentially looking back in time, but it doesn’t tell us what will happen tomorrow. This is where some guidance becomes invaluable. Just as we listen to weather forecasts to decide if we need an umbrella, we need similar indicators in trading to know what to buy.

Beginners often lack the knowledge of what’s required but are eager to learn before risking their money. As humans, we are conditioned to follow instructions, and at this stage, a simple procedure is all they seek.

The MACD indicator is perfect for this exercise
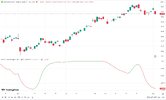
My idea was to present information in a simple-to-follow chart. It started with the "MACD SIGNAL LINE" changing colours. Green for buying and red for selling. While this was simple, I knew it could be improved.

#1. Signal Generator Coloured Signal Line and Price Chart.jpg

Skate.
 
My idea was to present information in a simple-to-follow chart. It started with the "MACD SIGNAL LINE" changing colours. Green for buying and red for selling. While this was simple, I knew it could be improved.

The Coloured Signal Line
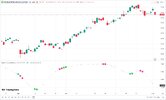
The colour changes of the signal line weren’t that easy to follow, which is why I introduced coloured dots. "Green dots" for buying and "red dots" for selling.

However, it became clear that having a day’s warning would be even more helpful. This led to the introduction of the "lime and fuchsia dots". A lime dot indicates a buy the next day, and a fuchsia dot indicates a sell the next day.

#1a. Signal Generator Coloured Dots and Price Chart.jpg

Skate.
 
By the way, the 20/10 positions were not cherry-picked, rather, I used the same companies as in a previous exercise, “The 20-ASX Investment Strategy.”

You keep saying that, and have provided your list. The problem is you haven't said what criteria you have used in coming up with that list, despite repeated questioning.

Your list is similar to the S&P/ASX 20 but leaves out COL and JHX and includes REA (S&P/ASX 100 member) and WTC (S&P/ASX 50 member as of 24 Jun 2024).

So, tell us:

Exactly what criteria have you used to select your universe of stocks for which you have performed your (apparently proven) system's results back to 1992?
 
Nebulous "dots" - This is far too vague. "Dot colours" - oh my.

"Dot colours" - oh my
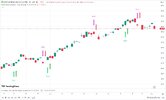
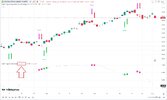
Some members have trouble understanding this concept, so I’m considering displaying a price chart with "lime and fuchsia arrows" to indicate the action for the next day. The "red and green arrows" show the bar where the trade was executed. This visual aid should make the concept clearer and easier to follow.

1. Signal Generator Price Chart with Signals.jpg

Skate.
 
Exactly what criteria have you used to select your universe of stocks for which you have performed your (apparently proven) system's results back to 1992?

@Richard Dale, I hate repeating myself, but here’s a summary of the criteria for selecting the universe of stocks for my system’s backtest. The hyperlinks are provided if you want to refresh your memory. To reiterate, I used the same companies as in a previous exercise, “The 20-ASX Investment Strategy.”


The list of 20 companies was taken from this exercise
Buying large-cap companies offers a solid alternative rooted in long-term stability, providing a balanced perspective on the potential advantages of this investment philosophy. Below are the results of a hypothetical $100,000, 20-position portfolio using this strategy over 12 months.

Investment Portfolio.jpg

Skate.
 
Release your code, define your actual trading rules rather than imprecise statements, and let others backtest it if you can't/won't.

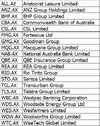
@Richard Dale, the “Signal Generator” is adapted from a Smoothed MACD indicator, which is an in-built indicator of TradingView. My “Signal Generator Strategy” is designed to trade 20 large ASX companies (below) as of the 1st of June 2024, and is diversified across 10 holdings, each allocated $10,000, capping the total investment at $100,000.

The Signal Generator Strategy - 20 ASX Companies Watchlist.jpg

The MACD Code
For simplicity, I’ve used the standard MACD settings for the "Signal Generator"

#2. Signal Generator Coloured Dots and Price Chart.jpg

1. Fast Period: Default value is 12.
2. Slow Period: Default value is 26.
3. MACD Signal: Default value is 9.
4. Smooth Period: Default value is 5.
5. Normalization Period: Default value is 20.
6. Price: The MACD calculation is based on the closing prices.

I’ve chosen the MACD for the "Signal Generator Trading Strategy" because it is a popular momentum indicator used to identify changes in the strength, direction, and momentum of a stock’s price.

Skate.
 
I'm unable to follow most meaningful aspects of your trading system despite 25 years of trading and coding experience with Metastock, TradeSim, AmiBroker, Python, Zipline, pysystemtrade, vector-bt, Wealth-Lab, TradeStation, RealTest plus my own coding.
Richard Richard Dale B.Sc. (Hons) Comp Sci

@Richard Dale I respect your qualifications and extensive experience in trading and coding. However, I must point out that the information you have been requesting has been available and clearly displayed on the TradingView charts I’ve posted. I’m puzzled as to why you have persisted in demanding information that was already provided.

#2. Signal Generator Settings.jpg

Skate.
 
Quite simply, just post the Pine Script.

@Richard Dale the Pine Script for the MACD indicator is freely available in TradingView under the indicators section. I’ve already explained the MACD settings, which are the default settings, and the only additions I’ve made are cosmetic to help beginners follow a simple dot system.

The Signal Generator has only two rules
(1) Buy the next day after a Lime Dot.
(2) Sell the next day after a Fuchsia Dot.

I encourage you to explore the indicator on TradingView to see how it works in practice.

Skate.
 
1. Trend Trading Logo.jpg
The 10-Position Breakout Strategy
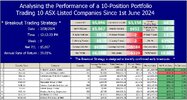
This hypothetical trading exercise focuses on trading 10 large ASX companies, selected from a watchlist of 10. Daily buy and sell signals are generated from the 1st of June 2024.

Simplified Reporting
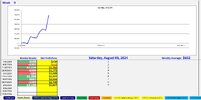
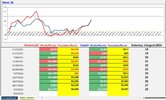
A weekly summary provides an at-a-glance display of ongoing results, with a date and time stamp to indicate the snapshot in time.

1b Open Summary.jpg


3. Weekly Results.jpg

Skate.
 
Quite simply, just post the Pine Script.
Richard, you need to understand, that pine script or any code script will never be release. When I google of " skate " or his creation I couldn't find him at trading view. I am sure I have asked him to reveal his code initially on this post!. or maybe he just showing the picture and request us to guess? It gives me an impression of " dangling the carrot in front of everyone"

Nothing is wrong is what he is doing, who ever keen to entertain or even buy in his show please dig in!
 
1. AI v Human Logo.jpg
Explanation
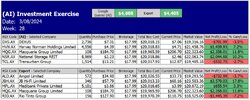
This is a theoretical investment exercise comparing the stock selections of expert fund manager Dr. Don Hamson and Google (AI) Gemini. Both provided their top 5 growth and income stocks for the ASX over the next 12 months.

Results
1st Place $4,608: Google Gemini (AI) - RED line on the equity chart (3 winning positions)
2nd Place $4,405: Dr. Don Hamson (Expert) - BLUE line on the equity chart (3 winning positions)


2. SummaryResult.jpg


3. WeeklyUpdate.jpg

Skate.
 
Richard, you need to understand, that pine script or any code script will never be release.

@bettamania the Pine Script for the MACD indicator is freely available in TradingView under the indicators section. I’ve already explained the MACD settings, which are the default settings, and the only additions I’ve made are cosmetic to help beginners follow a simple dot system.

TradingView
This software and indicators are freely available here: https://www.tradingview.com/

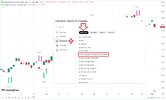
Pine Script MACD Indicator.jpg

Skate.
 
Firstly, you've also said it has been a a challenge to learn a new environment, so showing your Pine Script code that implements the English descriptions of the rules you have used would be a great contribution.

Secondly, it would allow others to verify and test your system.
 
Top