Australian (ASX) Stock Market Forum

Dump it Here

1. Trend Trading Logo.jpg
10-Position Breakout Strategy (Original Exercise)
The “10-Position Breakout Strategy” was designed to demonstrate the process of trading (10) large-cap stocks from a watchlist of (20) companies. The primary focus was on the procedure rather than on generating profits.

A Member Suggestion

A member proposed trading 10 large-cap stocks from a watchlist of 10 companies, believing it would be easier to manage and understand. This idea seemed unlikely to be a winning strategy, and even if it succeeded, the results were expected to be unimpressive.

Black Box Strategy
This exercise has been labelled a “black box” strategy, and at this point, that statement holds true. Even if you don’t fully understand the logic behind the strategy initially, having a system that tells you what to buy, when to buy, and when to sell is crucial for a beginner. Experience and understanding can come later.

Skate.
 
1. Trend Trading Logo.jpg
Further Analysis
It was suggested that I conduct a more thorough analysis of the 10-Position Strategy, as the initial logic of the exercise seemed less than useful. Doing additional backtesting has proven me wrong, as the ongoing weekly results haven’t been too shabby so far. However, this could be due to the recent favourable market conditions. This is why extensive paper trading is recommended to experience the full range of the market and establish a baseline for how the strategy will perform going forward.

After a deeper analysis
I identified two key backtest metrics: (a) Average Trade Duration and (b) Average Profit Factor. The hold period is around 51-77 days and the average profit factor is 1.8025.

Analysis
The average Profit Factor of 1.8025 suggests that while the strategy is profitable, it may not meet the higher expectations of some traders. This means that for every $1 lost, the strategy earns approximately $1.80. Although this is a positive return, it indicates a moderate level of profitability. Traders looking for higher returns might consider this factor when evaluating the strategy’s overall performance.

Summary
After further analysis, trading a different index or a larger watchlist may yield better results.

Skate.
 
#1. Signal Generator.jpg
The Signal Generator Trading System
This hypothetical trading exercise focuses on trading 10 large ASX companies, selected from a watchlist of 20. Daily buy and sell signals are generated from the 1st of June 2024.

Simplified Reporting
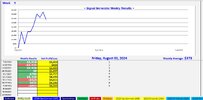
A weekly summary provides an at-a-glance display of ongoing results, with a date and time stamp to indicate the snapshot in time.

#1b. Open Summary.jpg


2. Weekly Results.jpg

Skate.
 
@Skate Sad to see that you're overlooking or just not posting about the main contributor to your trading edge. Restricting your trading to a universe of 20, crazy. even mentioning 10 , insane.

@peter2, I understand your concern about restricting trading to a universe of 20 or even 10 stocks. However, focusing on 10 or 20 top ASX companies can help newcomers feel more comfortable than speculating with the unknown.

The “Signal Generator Strategy” is a simple system with just two rules: (1) Buy the next day after a “Lime dot” and (2) Sell the next day after a “Fuchsia dot”. This approach is designed for those new to trading, using free software with a pre-made trading strategy that highlights the value of trusting signals and trading methodically.

The “10-Position Breakout Strategy” might seem crazy, focusing on 10 large-cap ASX stocks from a watchlist of 10. The current results from this breakout strategy aren’t too bad, but that could be due to the specific companies in the watchlist or perhaps the trading gods are on our side “at the moment.”

I firmly believe that sharing the actual paper trading results will be invaluable for those seeking a proven strategy. The “Signal Generator” and the “10-Position Breakout Strategy” act as a bridge, helping new traders transition from theoretical knowledge to practical application, and hopefully to successful live trading.

Skate.
 
No mention of the universe of 20 used or why it's even relevant, no metrics on backtests (# trades, backtest period, drawdown, sharpe ratio, ). 9 out of 10 positions are in the S&P/ASX 20. 1 position is in the S&P MidCap 50 (so it's somewhere in the 51-100 range).

In short, you've selected 10 stocks in a bull market and your backtest results go back two months.

This is pure selection bias.

I fail to see how this is useful.

I firmly believe that sharing the actual paper trading results will be invaluable for those seeking a proven strategy

You haven't provided any details to show this is a proven trading system at all.

Release your code, define your actual trading rules rather than imprecise statements, and let others backtest it if you can't/won't.
 
No mention of the universe of 20 used or why it's even relevant, no metrics on backtests (# trades, backtest period, drawdown, sharpe ratio, ). 9 out of 10 positions are in the S&P/ASX 20. 1 position is in the S&P MidCap 50 (so it's somewhere in the 51-100 range).

In short, you've selected 10 stocks in a bull market and your backtest results go back two months.

This is pure selection bias.

I fail to see how this is useful.


You haven't provided any details to show this is a proven trading system at all.

Release your code, define your actual trading rules rather than imprecise statements, and let others backtest it if you can't/won't.

@Richard Dale, let me address your questions one at a time.

The universe of 20 companies is the same as those used in the 20-Position Investment Strategy that I posted about previously. These companies were chosen for their familiarity and large-cap status. The universe could be any 20 well-known large-cap companies.

Regarding the metrics on backtests, I understand the importance of providing detailed information. The backtest period, number of trades, drawdown, and Sharpe ratio are all critical metrics to provide a comprehensive view of the strategy’s performance. Instead of satisfying your request immediately, I’ll keep posting the results as they progress and let that be the proof of the pudding.

As for the selection of 10/20 stocks in a bull market, I acknowledge that this may introduce selection bias. The intention was to create a straightforward and easy-to-follow strategy for newcomers, not to cherry-pick favourable conditions.

I believe I have released the actual trading rules previously. A quick search should find multiple posts with those details.

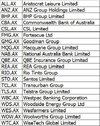
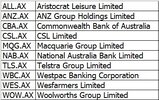
# The Signal Generator Strategy Watchlist - 20 ASX Companies

The Signal Generator Strategy - 20 ASX Companies Watchlist.jpg


# The Breakout Strategy Watchlist - 10 ASX Companies

The Breakout Strategy - 10 ASX Companies Watchlist.jpg

Skate.
 
Regarding the metrics on backtests, I understand the importance of providing detailed information. The backtest period, number of trades, drawdown, and Sharpe ratio are all critical metrics to provide a comprehensive view of the strategy’s performance. Instead of satisfying your request immediately, I’ll keep posting the results as they progress and let that be the proof of the pudding.

In a bull market, you don't need much skill. The skill is in preventing large drawdowns in downtrends/sideways trending markets.

You're saying "proven results" yet don't provide proof and say "just keep watching" and also don't provide any quantified rules for others to follow.

This is bad science.

You can redeem yourself - just post your (exact) rules.
 
In a bull market, you don't need much skill. The skill is in preventing large drawdowns in downtrends/sideways trending markets. You can redeem yourself - just post your (exact) rules.

@Richard Dale, I can’t challenge that statement.

However, I believe you might be missing the point of this exercise. It’s not solely about the performance of the strategy but rather an early introduction to the art of following a trading system. If the trading system turns out to be profitable, it offers a no-cost entry to the world of system trading.

Here are the key trading rules for the “Signal Generator Strategy”:
1. Buy the first 10 signals.
2. Only buy positions when necessary to fill a 10-position portfolio.
3. Prioritise buying the lowest-priced stocks.
4. Execute buy and sell orders in the pre-auction the very next trading day.
5. Determine position size by dividing the closing share price by the dollar value of your next bet.
6. Add 5% to the last closing price to formulate your buy offer.

The system has only two main rules:
Buy the next day after a “Lime Dot”.
Sell the next day after a “Fuchsia Dot”.

I believe I have released the actual trading rules previously. A quick search should find multiple posts on what drives this strategy.

Skate.
 
I believe I have released the actual trading rules previously. A quick search should find multiple posts on what drives this strategy.

I keep stating you haven't done this. Yet you keep saying you have done so.

So, let's get to some specifics:

What is your actual universe for each strategy?
What is starting date of your testing?

Lime Dot? Define it, precisely.
Fuschia Dot? Define it, precisely.

FYI, rules 5&6 combined mean you exceed your capital limits when you're trading to get to your position limit. I'm guessing you really mean "put your order at 5% above the prior market close and reduce your order size by the same".

The devil is in the detail - and you provide none of the detail, and no backtest/simulation of your strategy.

You continue to avoid any mention of your strategy universe (or rules to define your universe of candidate stocks) at all. "20" "10" - seems to be selection bias.

Show us you are not using recency bias by providing:
a) exact rules about your universe
b) exact rules on your entry signals
c) exact rules on your trade exits
 
@Richard Dale, I understand that no matter what I post or how much I share, it may never be enough. Instead of maintaining a negative attitude, I encourage you to step up and contribute constructively to the thread.

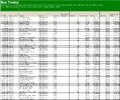
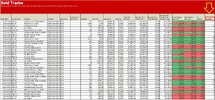
Regarding large drawdowns in downtrends or sideways markets, the “Signal Generator” moves in and out of the markets quickly. Since the start of the exercise (1st of June 2024), below is the actual buys and sells along with the hold period for transparency.

4. Buy Trades.jpg


5. Sold Trades.jpg

Skate.
 
I keep stating you haven't done this. Yet you keep saying you have done so.

So, let's get to some specifics:

What is your actual universe for each strategy?
What is starting date of your testing?

Lime Dot? Define it, precisely.
Fuschia Dot? Define it, precisely.

FYI, rules 5&6 combined mean you exceed your capital limits when you're trading to get to your position limit. I'm guessing you really mean "put your order at 5% above the prior market close and reduce your order size by the same".

The devil is in the detail - and you provide none of the detail, and no backtest/simulation of your strategy.

You continue to avoid any mention of your strategy universe (or rules to define your universe of candidate stocks) at all. "20" "10" - seems to be selection bias.

Show us you are not using recency bias by providing:
a) exact rules about your universe
b) exact rules on your entry signals
c) exact rules on your trade exits

@Richard Dale, regarding your questions:

What is your actual universe for each strategy?
The watchlists I’ve posted previously tonight.

What is (the) starting date of your testing?

1992.

Lime Dot? Define it, precisely
The lime dot is a buy signal. (a) The lime dot is generated only if the signal line turns green. (b) The signal line colour change is not displayed for chart simplicity. (c) The signal line was red two bars ago. (d) The trend is upward. (e) There was no previous buy signal or the last signal was a sell signal.

Fuschia Fuchsia Dot? Define it, precisely
The fuchsia dot is the sell signal. (a) The fuchsia dot is generated only if the signal line turns red. (b) The signal line was green two bars ago. (c) The trend is downward. (d) There was a previous buy signal or the last signal was a buy signal.

FYI, rules 5&6 combined mean you exceed your capital limits when you're trading to get to your position limit. I'm guessing you really mean "put your order at 5% above the prior market close and reduce your order size by the same".
I use a 5% premium to the last closing price to calculate the number of shares to buy in the pre-auction.

Show us you are not using recency bias by providing:
a) exact rules about your universe
b) exact rules on your entry signals
c) exact rules on your trade exits

(a) Universe

As mentioned, the selection isn’t crucial. The 20 companies were used in a previous exercise. The selection of the universe isn’t important; the 20 companies were previously used in another exercise.

(b) Entry Signals
This has been explained in detail. Please refer to my previous posts.

(c) Trade Exits
I’ve written a series of posts about this. It appears you haven’t caught up with what I’ve posted.

Skate.
 
@Richard Dale, this is a beginner thread designed to help those just starting their trading journey. Some members, including yourself, have been consistently demanding more information without contributing anything helpful in return. This behaviour is not in line with the spirit of our community.

Please remember, that the purpose of this thread is to share valuable insights and support each other. If you have knowledge or experience that could benefit others, I urge you to start contributing to help others if it’s in your nature. Your participation is crucial in making this thread a valuable resource for everyone.

Skate.

"Without contributing helpful in return"

Try again.

Here's what I'm contributing to this: You are the one posting "trading system" ideas without any scientific or verifiable basis. You are the one stating various facts about "just buy on the [xyz] colour" without providing any details. So I'm being the devil's advocate here.

Tell us HOW AND WHY you came up with such a system AND SHOW US THE RESULTS.

You've stated you backtested to 1992 - WHERE ARE THE RESULTS? Even better, show us your actual trade list.

You cannot state any ruies you have used for your universe that you have used for your backtest. "A selection of 10 stocks". OK - tell me exactly which 10 stocks you chose in January 2001, and why.

You cannot state any quantifiable entry rules. Read back on your posts - could anybody actually replicate your signals at all? I've only been doing this stuff for 25 years, and I can't even figure out any of your signals.

You cannot state your exit rules (and 2 months of trading hardly helps us test anything)

C'mon Skate - state your exact rules and forget your nebulous/motherhood statements on contribution. Critical analysis is contribution. Tell us everything we can use to accurately test anything you've said.

Yours sincerely,
Richard Dale B.Sc. (Hons) Comp Sci
 
What is your actual universe for each strategy?
The watchlists I’ve posted previously tonight.

I guess you don't understand by what I mean by "universe" so I'll try and explain this to you further.

What are your rules for your candidate stocks for your strategy? Are these rules consistently applied for backtesting?
 
I guess you don't understand by what I mean by "universe" so I'll try and explain this to you further.

@Richard Dale, I appreciate your enthusiasm and critical analysis in this thread. However, your posts should be constructive. To ensure we all benefit from this discussion, I encourage you to share your insights and experiences in a way that others can learn from. Being respectful and actively participating is crucial in making this thread a valuable resource for everyone. Regarding your mention of the "universe" could you please elaborate on what you mean by this term? I’m interested in understanding your perspective.

Skate.
 
Tell us HOW AND WHY you came up with such a system

Discovering an Effective Trading System
@Richard Dale, many system traders face challenges in discovering or coding a profitable trading system. Using TradingView and the standard built-in MACD indicator has allowed me to transform an indicator into a trading system. The “Signal Generator” is such a system, and it’s quite simple, albeit with some distractors.

The “Dump it here” thread is a platform to share personal trading experiences and knowledge, with the hope that it will help others in the future. Constructive criticism and mutual respect are essential for productive discussions. Negative comments or unreasonable requests without contributing positively to the conversation are not in the spirit of this thread.

In the next few posts, I will share the technical aspects of the Signal Generator and explain my purpose in writing about it. This series of posts is written for you in particular, but I’m sure others will also gain a better understanding of this simple strategy.

Skate.
 
Price Chart
For those new to trading, a price chart can often seem confusing and difficult to interpret. This is where the “Signal Generator” comes in, serving as an excellent starting point for learning about system trading. When information about system trading is presented in an engaging manner, it becomes easier to understand that trading with a well-defined plan and an unemotional mindset provides the discipline and consistency needed to navigate the markets effectively.

Skate.
 
Top