Australian (ASX) Stock Market Forum

Dump it Here

From a System Trader’s Perspective
In my opinion, there is no right or wrong method when it comes to trading. What works for one person might not work for another. It’s up to each individual to decide which method resonates with them.

Reading Chart Patterns & Researching Fundamentals
I agree that interpreting chart patterns and researching a company’s fundamentals can be subjective and vary from trader to trader. Getting a consensus is nearly impossible.

Fundamental Analysis
Personally, I find fundamental analysis to be time-consuming and not particularly enjoyable. It’s essentially a background check on a company’s past performance, assuming the information is accurate.

Chart Patterns
While patterns can look promising in hindsight, predicting future movements based on them can be challenging. We often become experts at identifying patterns after the fact, which is a major failing of most system traders.

Coding
I relate more to coding as a method of trading. It gives me the confidence to place trades through a mechanical trading system. For me, coding a trading idea stands head and shoulders above other tools in my trading toolbox.

Skate.
 
Fundamental Analysis
Personally, I find fundamental analysis to be time-consuming and not particularly enjoyable. It’s essentially a background check on a company’s past performance, assuming the information is accurate
Hmmmmmm, If you don't mind, for the benefit of any beginners out there, I would like to add a bit more information to your above statement @Skate ...

My perspective on Fundamental Analysis (which is the first 60% of my Research) is that Fundamental Analysis is both a "background check", and more importantly, it is "a look into a company's Future performance over the next 12 months or so"....

I spend quite a bit of time researching both areas of a company's Balance Sheet.....
For me, if a company does not measure up to my 60% pass mark, I do not bother with the Technical aspect of the equation, and accordingly those company's do not make it onto my Trading Watch List.....

IMO, 2 things punters should do are - "to understand what the companys vision is for their future, AND, to Ignore the Brokers Target Prices"....
Although I do, sometimes, tend to use those Target Prices as a reference for my Exit Points....

Reading through my 3 DrBourse Help Forums will explain my thoughts on Brokers Target Prices (don't think I need to repeat those thoughts again here)....

Cheers M8...

I rest my case
When members like @DrBourse contribute, it adds immense value to the “Dump it here” thread. An alternative view is the heart and soul of how we help others with information to do more research on matters that align with their current thinking. This thread is not about a contest of ideas but rather about sharing ideas from different perspectives.

Skate.
 
Acknowledging Valuable Contributions
Without valuable insights and experiences shared by members, this thread would lack its initial intent of helping those just starting out on their trading journey. I wish to acknowledge these members in alphabetical order:

@bossman
@Captain_Chaza
@cynic
@DaveTrade
@divs4ever
@DrBourse
@ducati916
@farmerge
@Miner
@noirua
@peter2
@qldfrog
@Richard Dale
@Sean K
@TimeISmoney

To every member who has had an input in this thread, it’s greatly appreciated and adds immense value to our small community.

Skate.
 
My first port of call for buying stocks is checking the amount of shorts, if it's anywhere above 6% I generally forget it but I usually go for stuff under 2%, the lower the better in my opinion. There's no point in opposing institutional investors who have billions more than me.

The second port of call I check the latest ASX notice releases for any bad info, and then I do a quick google on the latest news.
Then I look at charts, financials, and what service or product they are supplying, and which way is the service or commodity price moving.

I don't trust many analysts' reports, they're basically market makers to suit themselves, but you still have to watch their reports because they can trash a stock overnight and sheep follow quickly.

I spend a bit of time on charts to get the best entry point possible whether it's daily or weekly entries, sometimes you can get in and out of a stock by only charting for a quick buck but it's perilous.

Remember that no one can predict the future and you're never going to beat large institutions that are privy to info that you're not. They have billions and a team of players to control a stock. The best way to invest in the stock market is to work out how much it's going to cost you to take a chance to make money. I think we all hang onto a stock that never gets up and that should have been sold well before we end up holding the bag.

It's a big ongoing learning curve for me and I'll keep on adjusting my trading style to suit my needs and new market conditions.

My golden rule is always to check for shorts first and sometimes why it's been heavily shorted.
It instantly filters a lot of the crap out and then look for negative market news. If it passes those two I chart.
 
to Ignore the Brokers Target Prices"....
i don't actually ignore , but do take them with a big dose of cynicism , but i do notice them as the market MAY move in response

the smaller ( non-subscribers ) taking notice , and maybe jumping on the train , and the larger ( and probably subscribers ) taking the opposite side of the movement

now i don't do this for every broker analysis , but some shares do interest me , especially if they are liable to move ( and also they might highlight a point i wasn't already aware of ... say the implications of changes in Super regulations to AMP back in 2018 )
 
#1. Signal Generator.jpg
Original Signal Generator
The Original Signal Generator is designed to identify buy and sell signals based solely on the changes in the signal line’s colour. This system calculates the MACD (Moving Average Convergence Divergence) values using the fast and slow periods, and then smooths these values to create a signal line. The key aspect of this system is its focus on the colour change of the signal line. When the signal line turns green after being red, a buy signal is generated. Conversely, when the signal line turns red after being green, a sell signal is generated. These signals are plotted as tiny dots on the chart, shifted by 0.6 for better visibility. This system does not take into account the overall trend of the market, making it more reactive to short-term changes in the MACD values.

Skate.
 
10. Enhanced Signal Generator.jpg
Enhanced Signal Generator
The Enhanced Signal Generator builds upon the Original Signal Generator by incorporating trend conditions into the signal generation process. In addition to calculating the MACD values and the signal line, this system also determines the trend using a Simple Moving Average (SMA). The trend is considered up if the price is above the SMA and down if the price is below the SMA. This additional layer of trend analysis helps filter out false signals and provides more reliable buy and sell signals. For a buy signal to be generated, the signal line must turn green after being red, and the trend must be up. Similarly, for a sell signal to be generated, the signal line must turn red after being green, and the trend must be down. These signals are plotted as medium-sized dots on the chart without any shifting. By combining the colour change of the signal line with trend conditions, the Enhanced Signal Generator aims to provide more accurate and reliable trading signals.

Skate.
 
Charts.jpg

Two Systems on the one chart
When using the free version of TradingView, you are limited to only two indicators per chart. To work within this limitation, I’ve combined the “Signal Generator” and “Enhanced Signal Generator” into a single script. This approach allows me to display both strategies on the same chart while differentiating between their signals.

Here’s how it works
1. Signal Lines
: The buy and sell signals from each strategy are displayed on their own signal line, positioned a few millimetres apart on the chart. This separation makes it easy to distinguish between the signals generated by the two strategies.
2. Dot Sizes: The “Enhanced Signal Generator” uses medium-sized dots, while the “Signal Generator” uses smaller dots. This visual distinction helps to quickly identify which strategy generated each signal.

By combining both strategies into one script, I can effectively analyse and compare their performance without exceeding the indicator limit on the free TradingView platform.

Skate.
 
Strategy Differences
The key difference between the two systems lies in the incorporation of trend analysis. The "Original Signal Generator" focuses solely on the colour change of the signal line, making it more reactive to short-term changes in the MACD values. On the other hand, the "Enhanced Signal Generator" combines the colour change of the signal line with trend conditions determined by the SMA, resulting in more reliable and accurate trading signals. This makes the "Enhanced Signal Generator" better suited for traders who prefer a more comprehensive approach to signal generation.

In Summary
1. The “Original Signal Generator” is designed for traders who prioritise quick entry and exit from positions. This strategy’s agility can be particularly advantageous, as it allows traders to swiftly respond to market changes. By quickly getting in and out of positions, traders can avoid prolonged exposure to adverse market conditions. This approach aligns with the idea that sometimes, being cautious and retreating when the market gets tough can lead to better overall results.

2. On the other hand, the “Enhanced Signal Generator” incorporates trend analysis to provide more reliable signals. By considering the overall market trend, this strategy aims to filter out false signals and offer more stable trading opportunities. The use of medium-sized dots for the Enhanced Signal Generator helps differentiate its signals from those of the Original Signal Generator, making it easier to analyse and compare their performance.

Skate.
 
Acknowledging Valuable Contributions
Without valuable insights and experiences shared by members, this thread would lack its initial intent of helping those just starting out on their trading journey. I wish to acknowledge these members in alphabetical order:

@bossman
@Captain_Chaza
@cynic
@DaveTrade
@divs4ever
@DrBourse
@ducati916
@farmerge
@Miner
@noirua
@peter2
@qldfrog
@Richard Dale
@Sean K
@TimeISmoney

To every member who has had an input in this thread, it’s greatly appreciated and adds immense value to our small community.

Skate.
Professor without your valuable input none of this may not even take place.
ge
 
1. Trend Trading Logo.jpg
10-Position Breakout Trading Strategy
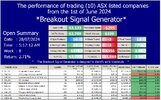
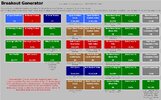
This hypothetical trading exercise is designed to trade 10 large ASX companies, selected from a watchlist of 10. The results are from the 1st of June 2024. The breakout trading strategy aims to profit from price movements by identifying when prices break out from established levels.

Simplified Reporting
Having all the trading metrics on a weekly open summary provides an at-a-glance display of the ongoing results, adding a date and time stamp to indicate the snapshot in time.

1b Open Summary.jpg


2. Breakout Generator Dashboard.jpg


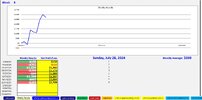
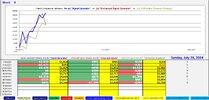
3. Weekly Results.jpg

Skate.
 
Comparison Logo.jpg
Comparative Equity Curve Analysis compares three trading strategies
(a) Original Signal Generator, (b) Enhanced Signal Generator, and (c) 10-Position Breakout Strategy. It assesses their relative performance over time, highlighting performance divergence and providing insights for evaluation.

1. Original Signal Generator
Identifies buy/sell signals based on the signal line’s colour change. Calculates and smooths MACD values to create a signal line. Green after red indicates a buy signal, and red after green indicates a sell signal. Signals are plotted as tiny dots. Focuses on short-term MACD changes, ignoring the overall market trend.

2. Enhanced Signal Generator
Adds trend conditions to the Original Signal Generator. Calculates MACD values, and the signal line, and uses SMA to determine the trend. Buy signal: green after red, trend up. Sell signal: red after green, trend down. Signals are plotted as medium-sized dots. This strategy aims for more accurate trading signals by combining signal line colour changes with trend conditions.

3. Skate’s 10-Position Breakout Strategy
Identifies bullish trends using multiple indicators (RSI, SMA, ATR) to generate buy/sell signals and manage risk. Monitors the (XAO) index to calculate the “Percentage Up Filter” for market sentiment, and measures trading strength, trend, and volatility. Buy signals: high (XAO) %UP market sentiment, RSI in range, price above 200-day SMA, breakout above recent high, volume surge. Sell signals: price below recent low or ATR-based stop-loss. Combines indicators for robust confirmations, focuses on breakouts, manages risk with ATR-based stop-loss, is adaptable, and provides clear entry/exit signals.


Combined Weekly Equity Curve.jpg

Skate.
 
given the ( US ) VIX is allegedly at low levels


do we have to factor in low volatility levels of the timing of when to apply these strategies , or at least track the success ( or not ) in difficult trends ( with that in mind )

low volatility implies less enthusiastic price movements ( and probably less of them in a week )
 
Not enough detail on your actual entry and exit rules for any of us to ascertain anything here

A Comprehensive Guide - "Skate’s 10-Position Breakout Strategy"
@Richard Dale, here’s an enhanced 10-point explanation of the "10-Position Breakout Strategy"

# 1. Overview
The "10-Position Breakout Strategy” is a trading strategy designed to help traders identify and capitalise on bullish trends in the market. By combining multiple technical indicators and specific conditions, this strategy generates precise buy and sell signals, aiming to capture significant price movements while effectively managing risk.

# 2. Key Features
(a) Watchlist and Data Collection (XAO Index): The strategy focuses on the All Ordinaries Index (ASX:XAO) and collects daily data on its closing price, opening price, and trading volume as this data is essential for calculating various technical indicators and conditions.
(b) Bullish/Bearish Sentiment Analysis (Percentage Up Calculations): The strategy calculates the percentage of days where the closing price is higher than the opening price. This metric provides insight into the overall bullish or bearish sentiment of the stock, helping traders gauge market sentiment. I've previously made a series of posts on this unique buy filter.

# 3. Buy Conditions (Technical Indicators)
(a) RSI (Relative Strength Index): The RSI measures the stock’s recent trading strength and identifies overbought or oversold conditions. An RSI value above 70 typically indicates overbought conditions, while a value below 30 indicates oversold conditions.
(b) SMA (Simple Moving Average): The 200-day SMA tracks the stock’s long-term trend. A closing price above the 200-day SMA suggests a bullish trend, while a price below it indicates a bearish trend.
(c) ATR (Average True Range): The ATR measures the stock’s volatility and helps set dynamic stop-loss levels. Higher ATR values indicate higher volatility, while lower values suggest lower volatility.

#4. Bullish Sentiment
(a) The percentage of bullish days (closing price higher than the opening price) must be above a specified percentage threshold.
(b) RSI Range: The RSI must be within a defined range, indicating that the stock is neither overbought nor oversold.
(c) Price Above SMA: The closing price must be above the 200-day SMA, indicating a bullish trend.
(d) Breakout: The stock price must break above a recent high (HHV), signalling a potential upward movement.
(e) Volume Surge: The current trading volume must exceed the average volume multiplied by a specified factor, indicating increased market interest.

# 5. Sell Conditions
(a) Breakdown: The stock price breaks below a recent low (LLV), signalling a potential downward movement.
(b) Stop-loss Trigger: The closing price falls below a dynamically calculated stop-loss level based on the ATR, helping to manage risk.

#6. Trade Management
(a) Entry: The strategy enters a long position when the buy conditions are met.
(b) Exit: The strategy exits the position when the sell conditions are triggered.
(c) Chandelier Exit: This approach sets stop-loss levels based on the ATR, adjusting to the stock’s volatility.
(d) The stop-loss level is calculated as the highest high (HHV) over a specified period minus a multiple of the ATR.

#7. Why This Strategy May Be Effective
(a) Combination of Indicators: The strategy employs multiple technical indicators (RSI, SMA, ATR) to ensure trades are based on robust confirmations, reducing the likelihood of false signals. This multi-indicator approach provides a comprehensive view of the stock’s performance.
(b) The strategy focuses on Breakouts: By targeting stocks breaking above recent highs, the strategy aims to capitalise on significant price movements and bullish momentum. Breakouts often indicate strong market interest and potential for continued upward movement.
(c) Risk Management: The use of ATR-based stop-loss levels helps manage risk by adjusting to the stock’s volatility. This ensures appropriate stop-loss placement, protecting against significant losses while allowing for potential gains.
(d) Adaptability: The strategy includes several customisable input parameters, allowing traders to modify the strategy based on their preferences and market conditions. This flexibility makes the strategy suitable for various trading styles, periodicity and market environments.

#8. Clear Entry and Exit Signals
The strategy provides clear and actionable buy and sell signals, making it easier for traders to execute trades the very next trading day. Clear signals help reduce ambiguity and improve decision-making.

#9. Successful trading is not just a matter of luck
Success in trading comes from focusing on what you can control. Develop a comprehensive trading plan with clear goals, trading styles, timeframes, risk management rules, and entry and exit strategies based on technical analysis. Mastering these elements may set you up for success, while market sentiment takes care of the rest.

#10. Confidence
Trust in the system is key. When you believe in the system, you’ll trade with conviction.

Skate.
 
do we have to factor in low volatility levels of the timing of when to apply these strategies , or at least track the success ( or not ) in difficult trends ( with that in mind )

@divs4ever, you brought up a crucial aspect of trading "timing and volatility". Your post has allowed me to expand on the “10-Position Breakout Strategy” and its “buy filter,” which I believe outperforms the traditional Index Filter for determining market trends.

TradingView coding can be challenging
Converting my Amibroker “PercentageUp” buy filter into TradingView code was quite a challenge, as it requires looping to measure the percentage bar-by-bar. Despite the difficulty, I believe this filter is a superior alternative for identifying market trends and is now an integral part of the “10-Position Breakout Strategy.”

A Better Alternative to Index Filters (PercentageUp Filter)
I’ve always believed that an “Index Filter” is better than nothing, but I think the “PercentageUp Filter” is a superior alternative.

The “PercentageUp Filter”
This filter is nothing more than a buy timing filter that correlates strongly with the All Ordinaries index (XAO). Buy positions can be taken when the market is bullish and the filter is above 45%. Conversely, when the filter drops below 25%, it signals a bearish market and adds to the exit strategy.

How The “PercentageUp Filter” Works
The filter identifies bullish or bearish market conditions based on the percentage of stocks in the index trading above a certain level.
(a) Above 45% indicates a bullish market, triggering buy positions.
(b) Below 25% indicates a bearish market, triggering exits.

Advantages
(a) The “PercentageUp Filter” is easy to understand and implement.
(b) Adapts to market volatility.
(c) Reduces whipsaws by aligning breakouts with overall trends.

Timing is crucial when buying and selling positions
The “PercentageUp Filter” is a valuable tool for analysing data and should be considered as an alternative to other filters. It enhances the performance of any strategy by providing precise setups and reducing whipsaws. The optimal time to buy is when a significant percentage of constituents in the All Ordinaries are rising within the index. The “PercentageUp Filter” not only adapts to market volatility but also helps you capitalise on market trends, maximising profits while minimising losses.

Skate.
 
The pronunciation of “PH” in English can indeed be tricky
The first YouTube video offers a casual explanation from a regular guy’s perspective. Both videos are great to watch on a lazy Sunday.


The second YouTube video
This exceptional video provides a more formal explanation of “PH.”


Skate.
 
Update Small.jpg
Feedback
I’ve received feedback that my updates are becoming hard to follow. To simplify things, I’ll be making some changes:

Friday: I’ll post the results of “Skate’s Original Signal Generator.”
Saturday: I’ll share the results of “Skate’s 10-Position Breakout Strategy.”
Sunday: I’ll provide a comparison between the two strategies.

This new schedule should make it easier to follow along.

Skate.
 
Top