Australian (ASX) Stock Market Forum

Dump it Here

Paper Trading Disappointment.jpg

The first week of paper trading the Dual Breakout Strategy resulted in a disappointing loss of $4,385 (-4.4%) on a $100,000 portfolio. While any losing week is frustrating, it's important to keep perspective, especially this early in the testing process. One week is a very small sample size and not nearly enough to draw definitive conclusions about the strategy's viability.

It's also useful to track the benchmark performance, like the ASX All Ordinaries which opened Monday at (7,489.9) and closed the week down modestly at (7,358.1) dropping (-1.76%). Comparing to the benchmark helps determine if the losses are a function of the overall market environment versus issues specific to the trading strategy.

While this first week is disappointing, sticking to the plan and fine-tuning based on insights from the paper trading is the best path forward. One week means very little on its own, but tracking performance over months of paper trading will reveal meaningful data to optimise the strategy. Patience and an analytical approach are key.

Skate.
 
More constructive criticism
I received some feedback that there is an overwhelming amount of reading required. This was eye-opening for me, as I hadn't realised just how text-heavy my content was. In future posts, I'll condense my ideas and present key concepts more concisely. My objective is to make my content easier to scan, read, and digest. Constructive criticism should motivate us all to improve.

Skate.
 
Paper Trading.jpg


4 Sell today
The 4 positions are placed in the pre-auction at the "Sell Offer"

Signals.jpg
The sell offer
This offer normally snags the opening price 99.9% of the time and if it doesn't the trading plan is to "Sell at 10:30 am" at the market. Today all 4 positions would have sold in the pre-auction at the "Sell Offer" price.

5. Sold Trades.jpg


11. Next update Friday.jpg
Skate.
 
We read that stop losses reduce system performance. This is especially so when the market trades in a sideways range for a long time. Trend traders are suffering "death by a thousand cuts" as we try to hang on. Trend trading isn't dead. It's just in a coma and will awake one day.

Frustration leads to considering changes to our trading style and we're tempted to trade shorter timeframes (daily, hourly). Think very carefully about doing this. Trend trading is much easier than swing trading. If we're not completely disciplined with our swing trade entries and exits then we'll lose our capital much faster than we like. I'd suggest swing trade the weekly charts and avoid the daily fluctuations. It's still a tough gig as our market remains in this large range.

@peter2, thank you for sharing your thoughts on stop losses and the challenges faced by trend traders in challenging markets. I completely agree that trading is all about striking a balance between protecting capital and allowing for potential trend continuation.

The analogy of 'death by a thousand cuts' accurately captures the frustration experienced by trend traders, however, it's important to remember that trends do eventually emerge, and when they do, they can provide significant opportunities.

Skate.
 

Wall Street closes lower, giving S&P 500 another losing week​

Wall Street capped a choppy week of trading with a broad slide for stocks Friday, giving the S&P 500 its second losing week in a row.

The frustration of trend trading
When the NYSE finishes lower, it can impact our markets at the start of next week. As a trend trader, I've experienced the frustration of a strategy generating signals that often don't follow through, leading to losses instead of profits.

As Monday looks to open lower, it's important to remember that each trading strategy will still produce signals before the close of the NYSE. This reinforces the need for us to remain focused on our trading goals and be prepared to seize the moment when the trend reawakens.

In my next post, I will display the signals generated from one of my systems and provide insights into whether these signals follow through. By analysing the outcomes of these signals, we can gain valuable insights and refine our trading approach

Skate.
 
Small Pressure.jpg

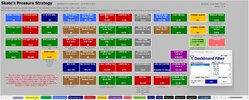
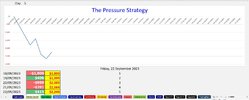
I would like to share with you the signals generated from my 'Pressure Strategy' and their outcomes by the end of the week. By analysing these signals, we can gain valuable insights into their follow-through and use this information to refine my trading approach.

Pressure STRATEY signals.jpg

Skate.
 
Correlation

@ducati916, if only real-time correlation could be reliable. It's a captivating concept that many consider to be the ultimate solution. In your recent post, could you kindly provide an explanation of the presented data and shed some light on the intriguing "reverse correlation" observed since the end of May.

# It would be fascinating to understand the factors contributing to this phenomenon.

Skate.
 
Screen Shot 2023-09-17 at 3.19.23 AM.png

Same chart over 20yrs.

Think of the correlations fluctuating between 0.0 and 1.0 depending on the broad macro conditions prevailing for asset classes. In 2008 the correlation went to 1 as the entire financial system was being driven to collapse due to highly leveraged debt defaulting.

The outperformance of the ASX between 2009 - 2015 was largely driven by a commodity boom (also between 2004 - 2008).

Currently there is a currency war combined into a commodity war being fought between East and West. The West is trying to suppress commodity prices via weaponising the USD. Which is impacting your market and has done for the last couple of years meaningfully.

This is because the AUD is linked to the USD through commodity pricing and why the BRICS are breaking that monopoly and moving to gold as the reserve asset (replacing UST). Australia is part of the 5-Eyes etc. and has heavily bought into the G7 etc.

Needless to say the West is getting hammered because of the levels of debt as the cost of capital rises.

jog on
duc
 
I regularly 'backtest' my system to see what is happening.

@investtrader made a thought-provoking post in @peter2 thread with an interesting screen capture. With any report or graph, it's an important aspect to consider when analysing data is the potential for misinterpretation when only observing the available data being presented.

The issue is that data can be misleading when it is derived from a process that "evolves and changes" over time. When data undergoes changes, the patterns and relationships within the data tend to break down as seen in @ducati916 first daily chart. Presenting the same data in a different monthly time frame and the chart presents something different.

By recognising the limitations of data derived from a changing process, we can avoid drawing erroneous conclusions and ensure a more accurate analysis process.

Skate.
 
Ahoy there Capn Skates

I note that our LOT has released a Report after hours Friday night 452 Pages
I hope You Like Reading
I don't !

I hope it's a good report as I am Selling on the Open
I don't take Stress all that well

Do you think anybody reads 452 page reports over the Week-end?
In the Good Old Days we used to READ after 9.oo am and then after a nice liquid lunch of Dutch Courage come back to the office and do a few magic trades

They were the Good Old Days
 
It has been a tough week for "Trend Traders"
Trend trading offers the potential for quick profits from short-term price movements and the flexibility to adapt to changing market conditions. Normally it's an enjoyable hands-on involvement. However, trend trading is currently demonstrating the stress of unpredictability.

Long-term investing has its place
Long-term investing offers the potential for compounding returns over time with dividends thrown in and lower transaction costs. Long-term investing also requires less emotional involvement. However, it demands patience as returns may take years to develop due to market downturns, and are reliant on the overall market performance over time.

Skate.
 
Ahoy Capn Skates

I saw and published on Sunday that a Cold Front was imminent and why
As you and I both Know
LONG TERM INVESTING is an OXIMORON
It was invented by the In Experienced Advisors and Snake Oil Salesmen as a Disclaimer

"She'll be right in the Long Term" they always say
My advice to all your beginners is
"Beware of anyone " who Preaches "She'll be right in the Long Term"


Because THIS is NOT TRUE in the vast majority of cases

IMHO It is always used as a COVERUP of MISTAKES and poor investing decisions

Can anyone think of a Better Coverup excuse for such bad advice?


Salute and Stay Safe
Invest.jpg
 
Last edited:
Small Pressure.jpg

It has been a challenging week for trend trading, with mixed results across various strategies. It appears that the timing of when you initiate a new trading strategy plays a crucial role in its success.

1. Dashboard.jpg


Despite the "Pressure Strategy" being designed as a weekly trading approach, I believe sharing insights about the individual trading days might help shed light on the challenges encountered throughout the week.

2. Weekly Results.jpg


4. Open Summary.jpg


6. Exploration Signals.jpg


10. Next update Monday.jpg
Skate.
 
Paper Trading Disappointment.jpg

@qldfrog's "sad face emoji" accurately reflects the trading results of this strategy so far. However, it's important to note that over a short 3-week period, the results are a direct reflection of the current trading conditions.

The backtest results I posted previously are based on certain assumptions about the market, such as trend, volatility, and correlation, which may not hold true in the current market environment. While these assumptions are essential in determining the trading strategy and risk management rules, it's important to recognise that they may not always hold true. Market sentiment can change rapidly, and a strategy that performed well in the past may not perform well in the current market conditions.

It's important to keep in mind that the previous backtest results are only an estimate of the potential performance of a trading strategy, and there are many factors that can affect the accuracy of these results, as @Richard Dale has pointed out. Therefore, it's essential for me to continuously monitor and adjust the strategy to ensure it remains effective in the current market conditions.

Skate.
 
Top