Australian (ASX) Stock Market Forum

Dump it Here

At the Platinum level, this is not required as your backtesting code accesses a "Current & Past" watchlist where the security will remain, and you'd use the NorgateIndexConstituentTimeSeries function in your trading rules.

@Richard Dale, I appreciate your prompt response and the workaround you have proposed. However, it is evident that in order to address this issue effectively, the most straightforward solution is for developers or traders to upgrade to the "Platinum Subscription level." The lower-level subscription models indeed have limited value and may not provide the necessary features and functionalities required for comprehensive backtesting and trading.

By opting for the Platinum Subscription level, users gain access to a "Current & Past" watchlist, ensuring that open positions can be tracked even if a security is no longer in the regular watchlist. Additionally, the availability of the NorgateIndexConstituentTimeSeries function further enhances the trading rules and capabilities within the backtesting code.

Therefore, for those serious about developing effective trading strategies and maximising the potential of AmiBroker, I strongly recommend considering the "Platinum Subscription level" as it offers the most comprehensive features and eliminates the limitations associated with lower subscription tiers.

Thank you once again for your insight and assistance in addressing this matter.

Skate.
 
I'm disgusted that speculative stocks like AVZ and BRN get into the ASX200 in the first place.

Note: BRN is finally being removed from the ASX200 soon (Sept 18th).

But another speculative company WBT is getting into the ASX200. Come on, S&P get serious.
S&P relies on Market Cap..... Does it not?
 
View attachment 161951

@Richard Dale, I appreciate your assistance in providing the "S&P/ASX Australian Indices Methodology PDF." It has shed light on an important aspect that I would like to further clarify.

Currently, I am subscribed to the "Silver" subscription level and have learned from the PDF that the rebalancing of the S&P/ASX Australian index series takes place regularly. The trading data is referenced to the second-to-last Friday of the month prior to the rebalancing.

Specifically, the All Ordinaries index, which is the index I exclusively trade, undergoes annual rebalancing, occurring after the market closes on the third Friday of March. Consequently, the entire S&P/ASX index series is rebalanced after the market closes on the third Friday of March.

Now, here is my question
Consider a scenario where my strategy, implemented through Amibroker with the "Filter" Watchlist and the selection of the "All Ordinaries," generates a buy signal before the market closes on the third Friday of the month of March. In this case, after the All Ordinaries is rebalanced, the buy signal gets downgraded and removed from the "All Ordinaries Index." This poses a significant dilemma, as it implies that I would never receive a "SELL" signal, which could have disastrous consequences for a trader who relies on following strategy signals.

# Am I correct in assuming this, and if so, do you have any suggestions on how I can overcome this issue?

Thank you for your attention to this matter, and I eagerly await your guidance on addressing this challenge effectively.

Skate.
That actually explains some of the weird behaviour I experienced on a couple of packets years ago
 
S&P relies on Market Cap..... Does it not?

The S&P/ASX 20, 50, 100, 200 indices are based on free float market cap, rebalanced quarterly.
The S&P/ASX 300 is based on free float market cap, rebalanced semi-annually (i.e. twice a year)
The All Ords is on market cap, rebalanced anually.

There's also some rules relating to buffers to limit portfolio turnover.

More details here:
https://www.spglobal.com/spdji/en/documents/methodologies/methodology-sp-asx-australian-indices.pdf
 
Amibroker Logo.jpg

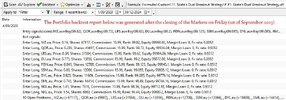
# Backtest Portfolio Report - as of the close on Friday 1st of September
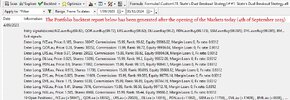
If you have the patience to follow along I will show you the changes the portfolio Backtest report makes from the end-of-trade Friday to the opening of the markets (today) - Monday 4th September 2023. The report is like chalk and cheese and not to be trusted trading from this report

The Amibroker Backtest Portfolio report drastically changes between the end-of-week close prices on Friday and the actual market open prices on Monday, illustrating the severe limitations of relying solely on backtested simulations without supplemental validation when committing real capital.

# Portfolio Backtest Report - Friday 1st of September 2023

Week 1 Backtest Portfolio Signals.jpg


# Portfolio Backtest Report - After the markets open on Monday 4th of September 2023

Week 1 Backtest Portfolio Signals AFTER THE MARKETS OPEN.jpg

Full evaluation
Here is an improved in-depth comparison and evaluation of trading using the Amibroker Backtest Portfolio feature based on the two provided reports:

Summary - 1
(1) Trading strategies based solely on Amibroker backtests can lead to misleading expectations of performance. Backtests use historical data and cannot account for future price movements.

(2) The two reports illustrate the risks of relying on backtest simulations. The share prices after the market opened were higher than the historical data used in the initial backtest.

(3) This led to lower share quantities being purchased and less remaining cash than initially projected. The portfolio value was ultimately higher due to the increased prices, but this outcome could not have been predicted.

(4) Backtests can provide useful insights into strategy logic and mechanics but have limitations for estimating actual future performance. Real-time paper trading and rigorous manual testing should supplement backtesting.

(5) Key factors like execution slippage, spread costs, and trading commissions can significantly impact performance but are not captured in backtests. Amibroker assumes perfect no-slippage entry and exit.

(6) Overall, backtesting provides an optimistic estimate of returns. Strategies should not rely solely on backtest simulations and require supplemental validation through other means before committing real capital.

Individual Stock Comparison:

IVZ.au

- Backtest Limitation:
- Failed to predict +15.6% price increase after open

QOR.au
- Backtest Limitation:
- Failed to predict +19.1% price increase after open

LRS.au
- Backtest Limitation:
- Failed to predict +8.8% price increase after open

DLI.au
- Backtest Limitation:
- Failed to predict +6.5% price increase after open

PDN.au
- Backtest Limitation:
- Failed to predict +6.5% price increase after open

SSM.au
- Backtest Limitation:
- Failed to predict +2.8% price increase after open

EML.au
- Major Backtest Limitation:
- Failed to predict +54.4% price increase after open

NXL.au
- Backtest Limitation:
- Failed to predict a +2.9% price increase after open

Summary - 2
Backtests have limitations that require supplemental validation before committing real capital. The reports illustrate the risks of over-reliance on simulated historical performance data. Here is an in-depth comparison of each security between the two Amibroker Backtest Portfolio reports:

IVZ.au
#
Before Open:
- Buy signal, score 99.82
- Price: 0.16
- Shares: 67,117
- Commission: 15.99
- Equity contribution: $99,968.02
# After Open:
- Buy signal, score 99.82
- Price: 0.185 (+15.6% higher than before open)
- Shares: 58,047 (-13.5% lower than before open)
- Commission: 15.99
- Equity contribution: $99,968.02 (same)

QOR.au
#
Before Open:
- Buy signal, score 99.72
- Price: 0.235
- Shares: 45,697
- Commission: 15.99
- Equity contribution: $99,936.04
# After Open:
- Buy signal, score 99.72
- Price: 0.28 (+19.1% higher than before the open)
- Shares: 38,352 (-16.1% lower than before the open)
- Commission: 15.99
- Equity contribution: $99,936.04 (same)

LRS.au
#
Before Open:
- Buy signal, score 99.62
- Price: 0.34
- Shares: 31,584
- Commission: 15.99
- Equity contribution: $99,904.06
# After Open:
- Buy signal, score 99.62
- Price: 0.37 (+8.8% higher than before the open)
- Shares: 29,023 (-8.1% lower than before the open)
- Commission: 15.99
- Equity contribution: $99,904.06 (same)

DLI.au
#
Before Open:
- Buy signal, score 99.2
- Price: 0.775
- Shares: 13,856
- Commission: 15.99
- Equity contribution: $99,872.08
# After Open:
- Buy signal, score 99.2
- Price: 0.825 (+6.5% higher than before open)
- Shares: 13,016 (-6.0% lower than before open)
- Commission: 15.99
- Equity contribution: $99,872.08 (same)

PDN.au
#
Before Open:
- Buy signal, score 99.125
- Price: 0.845
- Shares: 12,708
- Commission: 15.99
- Equity contribution: $99,840.10
# After Open:
- Buy signal, score 99.125
- Price: 0.9 (+6.5% higher than before open)
- Shares: 11,932 (-6.1% lower than before open)
- Commission: 15.99
- Equity contribution: $99,840.10 (same)

SSM.au
#
Before Open:
- Buy signal, score 99.095
- Price: 0.89
- Shares: 12,066
- Commission: 15.99
- Equity contribution: $99,808.12
# After Open:
- Buy signal, score 99.095
- Price: 0.915 (+2.8% higher than before open)
- Shares: 11,736 (-2.7% lower than before open)
- Commission: 15.99
- Equity contribution: $99,808.12 (same)

DYL.au
*
No difference in share price, quantity, commission, or equity contribution before and after the open

EML.au
#
Before Open:
- Buy signal, score 98.89
- Price: 0.745
- Shares: 14,414
- Commission: 15.99
- Equity contribution: $99,744.16
# After Open:
- Buy signal, score 98.89
- Price: 1.15 (+54.4% higher than before open)
- Shares: 9,338 (-35.2% lower than before open)
- Commission: 15.99
- Equity contribution: $99,744.16 (same)

NGI.au
*
No difference in share price, quantity, commission or equity contribution between before and after open

NXL.au
#
Before Open:
- Buy signal, score 98.44
- Price: 1.54
- Shares: 6,863
- Commission: 15.99
- Equity contribution: $99,680.20
# After Open:
- Buy signal, score 98.44
- Price: 1.585 (+2.9% higher than before open)
- Shares: 6,668 (-2.8% lower than before open)
- Commission: 15.99
- Equity contribution: $99,680.20 (same)

Summary - 3
(a) All stocks except DYL and NGI had higher prices after the opening than before the opening.
(b) The increased stock prices resulted in lower share quantities purchased to stay within the available equity.
(c) Total equity contribution remained the same for each position between the two reports.
(d) Higher stock prices led to higher total portfolio value after opening ($100,424.86) compared to before opening ($109,999.25).
(e) Remaining unused cash was lower after opening ($0.96) than before the opening ($0.73).

Skate.
 
Paper Trading.jpg

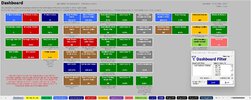
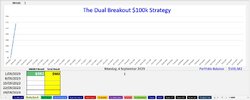
Simulated trading update
Attached are screenshots of the simulated trading account as of (11:00 am) on Monday, September 4, 2023. This illustrates the beginning of the paper trading exercise to evaluate the "Dual Breakout Strategy" in real market conditions.

Weekly Friday updates will be in this format
To start the "Paper Trading" exercise of the "Dual Breakout Strategy" these are the first results to get the ball rolling. The screenshots provide transparency into the current open positions, closed trades, account balance, and equity curve from paper trading the strategy. Sharing these periodic weekly updates allows assessment of how the strategy performs over time, rather than relying solely on backtested hypothetical results.

The updates will be shared weekly to track ongoing progress
Trades will be executed according to the strategy rules. This hands-on approach aims to supplement backtest results with real-world feedback before risking capital. It provides greater insight into the potential strengths and weaknesses of the strategy.

In summary
These periodic updates will help evaluate the strategy by "transparently tracking paper trading" in real market conditions over time.

1. Dashboard.jpg


2. Weekly Results.jpg


3. Buy Trades.jpg


4. Open Summary.jpg


11. Mondays Next update Friday.jpg

Skate.
 
@Skate Overnight gaps are quite normal. There is no backtest limitation happening here. I think you're barking up the wrong tree.

If you want to enter at next day open, then do that with an appropriate order type (with reduced order quantity to allow your system a bit of leeway with respect to capital).

If you want to do limit orders (which may or may not be filled due to the overnight gap) then program your system to do that.

If you want to put in an order for a fixed dollar amount then the quantity will obviously change from the prior close and you will need to manage that in the pre-open.

Are the results _severely_ limited or different. Not at all.
 
If you want to enter at next day open, then do that with an appropriate order type (with reduced order quantity to allow your system a bit of leeway with respect to capital).

@Richard Dale, I trade weekly systems where the buy and sell signals are generated after the close on Fridays. I then place those orders in the pre-auction at a 3% premium to the prior close's price, if my "Percentage Up" buy filter is true.

If the price gaps up above my 3% premium level, my order won't get filled. I don't chase the price - using this pre-auction strategy with the premium takes the guesswork out of trying to time entries. Even with this approach, there's still a risk my order fails to execute due to a "gap up".

Whether the 3% premium secures the open price or not, a buy order not filling has minimal impact on my strategy's overall profitability. I hold 10 positions in the portfolio, so one missed trade won't make or break the performance. The gaps tend to average out over many trades anyway.

You're right, overnight gaps are normal market conditions. I don't think there are major backtesting limitations here from the occasional unfilled order. The results are not severely limited or different because of them. I appreciate you pushing me to clarify how I handle weekend gaps - it's helped me explain my process better.

Week #1 - Exporation Raw Signals.jpg

Skate.
 
Well I'm glad you've decided to stopped being alarmist about normal market behaviour (open next day versus close previous day). I find it weird you portrayed this as a severe limitation of backtesting.
 
Well I'm glad you've decided to stopped being alarmist about normal market behaviour (open next day versus close previous day). I find it weird you portrayed this as a severe limitation of backtesting.

@Richard Dale, over the last few posts I apologise for coming across as alarmist about backtesting and the shortcomings with your Data Subscription level. You acknowledged and rectified one of my concerns and supplied helpful information about another. The limitations I find with backtesting in Amibroker are due to my own limited coding knowledge. Where I find issues with the trading process confusing, it makes for a worthwhile discussion to post about them directly, in hopes of helping others understand.

The "Dual Breakout Strategy," even though it was developed with incomplete data, the paper trading exercise is still valuable for those starting out to understand the backtesting process and why "paper trading" is an important step before live trading.

With any discussion, the key is to acknowledge the other person's viewpoint, while still expressing an alternative perspective. Acknowledging my own limitations can lead to a more constructive and polite discussion. The goal is finding common ground rather than portraying the other person's shortcomings.

Skate.
 
View attachment 161966

# Backtest Portfolio Report - as of the close on Friday 1st of September
If you have the patience to follow along I will show you the changes the portfolio Backtest report makes from the end-of-trade Friday to the opening of the markets (today) - Monday 4th September 2023. The report is like chalk and cheese and not to be trusted trading from this report

The Amibroker Backtest Portfolio report drastically changes between the end-of-week close prices on Friday and the actual market open prices on Monday, illustrating the severe limitations of relying solely on backtested simulations without supplemental validation when committing real capital.

# Portfolio Backtest Report - Friday 1st of September 2023

View attachment 161969


# Portfolio Backtest Report - After the markets open on Monday 4th of September 2023

View attachment 161970

Full evaluation
Here is an improved in-depth comparison and evaluation of trading using the Amibroker Backtest Portfolio feature based on the two provided reports:

Summary - 1
(1) Trading strategies based solely on Amibroker backtests can lead to misleading expectations of performance. Backtests use historical data and cannot account for future price movements.

(2) The two reports illustrate the risks of relying on backtest simulations. The share prices after the market opened were higher than the historical data used in the initial backtest.

(3) This led to lower share quantities being purchased and less remaining cash than initially projected. The portfolio value was ultimately higher due to the increased prices, but this outcome could not have been predicted.

(4) Backtests can provide useful insights into strategy logic and mechanics but have limitations for estimating actual future performance. Real-time paper trading and rigorous manual testing should supplement backtesting.

(5) Key factors like execution slippage, spread costs, and trading commissions can significantly impact performance but are not captured in backtests. Amibroker assumes perfect no-slippage entry and exit.

(6) Overall, backtesting provides an optimistic estimate of returns. Strategies should not rely solely on backtest simulations and require supplemental validation through other means before committing real capital.

Individual Stock Comparison:

IVZ.au

- Backtest Limitation:
- Failed to predict +15.6% price increase after open

QOR.au
- Backtest Limitation:
- Failed to predict +19.1% price increase after open

LRS.au
- Backtest Limitation:
- Failed to predict +8.8% price increase after open

DLI.au
- Backtest Limitation:
- Failed to predict +6.5% price increase after open

PDN.au
- Backtest Limitation:
- Failed to predict +6.5% price increase after open

SSM.au
- Backtest Limitation:
- Failed to predict +2.8% price increase after open

EML.au
- Major Backtest Limitation:
- Failed to predict +54.4% price increase after open

NXL.au
- Backtest Limitation:
- Failed to predict a +2.9% price increase after open

Summary - 2
Backtests have limitations that require supplemental validation before committing real capital. The reports illustrate the risks of over-reliance on simulated historical performance data. Here is an in-depth comparison of each security between the two Amibroker Backtest Portfolio reports:

IVZ.au
#
Before Open:
- Buy signal, score 99.82
- Price: 0.16
- Shares: 67,117
- Commission: 15.99
- Equity contribution: $99,968.02
# After Open:
- Buy signal, score 99.82
- Price: 0.185 (+15.6% higher than before open)
- Shares: 58,047 (-13.5% lower than before open)
- Commission: 15.99
- Equity contribution: $99,968.02 (same)

QOR.au
#
Before Open:
- Buy signal, score 99.72
- Price: 0.235
- Shares: 45,697
- Commission: 15.99
- Equity contribution: $99,936.04
# After Open:
- Buy signal, score 99.72
- Price: 0.28 (+19.1% higher than before the open)
- Shares: 38,352 (-16.1% lower than before the open)
- Commission: 15.99
- Equity contribution: $99,936.04 (same)

LRS.au
#
Before Open:
- Buy signal, score 99.62
- Price: 0.34
- Shares: 31,584
- Commission: 15.99
- Equity contribution: $99,904.06
# After Open:
- Buy signal, score 99.62
- Price: 0.37 (+8.8% higher than before the open)
- Shares: 29,023 (-8.1% lower than before the open)
- Commission: 15.99
- Equity contribution: $99,904.06 (same)

DLI.au
#
Before Open:
- Buy signal, score 99.2
- Price: 0.775
- Shares: 13,856
- Commission: 15.99
- Equity contribution: $99,872.08
# After Open:
- Buy signal, score 99.2
- Price: 0.825 (+6.5% higher than before open)
- Shares: 13,016 (-6.0% lower than before open)
- Commission: 15.99
- Equity contribution: $99,872.08 (same)

PDN.au
#
Before Open:
- Buy signal, score 99.125
- Price: 0.845
- Shares: 12,708
- Commission: 15.99
- Equity contribution: $99,840.10
# After Open:
- Buy signal, score 99.125
- Price: 0.9 (+6.5% higher than before open)
- Shares: 11,932 (-6.1% lower than before open)
- Commission: 15.99
- Equity contribution: $99,840.10 (same)

SSM.au
#
Before Open:
- Buy signal, score 99.095
- Price: 0.89
- Shares: 12,066
- Commission: 15.99
- Equity contribution: $99,808.12
# After Open:
- Buy signal, score 99.095
- Price: 0.915 (+2.8% higher than before open)
- Shares: 11,736 (-2.7% lower than before open)
- Commission: 15.99
- Equity contribution: $99,808.12 (same)

DYL.au
*
No difference in share price, quantity, commission, or equity contribution before and after the open

EML.au
#
Before Open:
- Buy signal, score 98.89
- Price: 0.745
- Shares: 14,414
- Commission: 15.99
- Equity contribution: $99,744.16
# After Open:
- Buy signal, score 98.89
- Price: 1.15 (+54.4% higher than before open)
- Shares: 9,338 (-35.2% lower than before open)
- Commission: 15.99
- Equity contribution: $99,744.16 (same)

NGI.au
*
No difference in share price, quantity, commission or equity contribution between before and after open

NXL.au
#
Before Open:
- Buy signal, score 98.44
- Price: 1.54
- Shares: 6,863
- Commission: 15.99
- Equity contribution: $99,680.20
# After Open:
- Buy signal, score 98.44
- Price: 1.585 (+2.9% higher than before open)
- Shares: 6,668 (-2.8% lower than before open)
- Commission: 15.99
- Equity contribution: $99,680.20 (same)

Summary - 3
(a) All stocks except DYL and NGI had higher prices after the opening than before the opening.
(b) The increased stock prices resulted in lower share quantities purchased to stay within the available equity.
(c) Total equity contribution remained the same for each position between the two reports.
(d) Higher stock prices led to higher total portfolio value after opening ($100,424.86) compared to before opening ($109,999.25).
(e) Remaining unused cash was lower after opening ($0.96) than before the opening ($0.73).

Skate.
I fail to understand the issue there .
The backrest results are not modified only the execution of the orders.
You need to ensure your code enforce your limit in price if any or you run with whatever price is at open.
When trading, I give a margin to my purchase price so that potentially prevent it from being executed if a gap up occurs.
Likewise the packet $ value will be different from backtests planned one as my orders are for a fixed number of shares, not a dollar value..that is a broker limitation
You either acknowledge that or try to code it so that backtests of past purchases include these limitations when possible.
There is nothing wrong looking forward in your code to ensure the amount purchase in backtest is based on the next open price.
That assumes that you can buy at open price..not a given but usually right as your real broker order can have a margin..but only within a limited range
Anyway, not surprised and yes it is near impossible to code gap up in AB..I noticed "backrest" a lot..self corrected.i tried to fix this but might not be failproof
I should have read David and Skate responses..all in agreement ultimately.so my post of limited value
 
I should have read David and Skate responses..all in agreement ultimately.so my post of limited value

@qldfrog, this might be a good time to share some screenshots to help others understand how my trading strategy works in action.

The "Dual Breakout Strategy" has over 1,000 lines of code that determine four key things:
1. What stocks to buy
2. How many shares to purchase
3. The price to bid during pre-market trading
4. My total investment per share

My goal is to get filled at the opening price
To accomplish this, the strategy bids 3% above the previous closing price. Using this technique, I'm able to get filled 99.99% of the time. The strategy makes trading simple by automating these complex decisions. But there's some sophisticated logic running under the hood!

After the market closes on Friday
I select the strategy and load it into Amibroker. I hit the "Explore" button to run the Exploration Analysis, which generates trade signals. The analysis output is formatted as a colourful "Filter" that displays all the key details I need to place orders in CommSec.

Analysis format
I really like how this standardised format lines up perfectly with my trading workflow. Below I've attached some screenshots to illustrate the strategy in action.

1. Exploration Analysis
I have shown one buy position so following along is uncomplicated.

Exploration Signals.jpg

Placing the order in CommSec
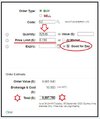
I've attached a screenshot highlighting key areas of interest in the CommSec order entry form. In red (a), you can see the "offer price" of $0.19 taken from the Exploration Analysis output. This price is entered as the "price limit" for the order.

In red (b), the buy order duration is set to "good for day." This means if the position doesn't fill by the end of the trading day, the order will be cancelled.

The Exploration Analysis provides the precise price limit needed to target the opening price. By setting the order to expire same-day, I avoid leaving open orders that may fill at less ideal prices on subsequent days.

This screenshot illustrates how the strategy's analysis seamlessly flows into the trading platform. The Exploration output contains all the details required to rapidly enter orders with confidence. Let me know if more context on this stage of the process would be helpful!

IVZ Buy.jpg

Buy (IVZ)
Once the buy order for IVZ is filled, I enter the trade confirmation details into "Share Trade Tracker". As you can see in the screenshot, the number of shares #52,536 for IVZ was executed at a price of $0.185.

A total of 52,536 shares were purchased. Share Trade Tracker allows me to log each trade with the relevant specifics like quantity, price, fees, etc. This provides an audit trail and performance tracking for every trade made across multiple strategies and accounts. By documenting each transaction, I'm able to analyse my trading activity over time to identify strengths, weaknesses, and opportunities to optimize.

3. Buy Trades.jpg

Skate.
 
LOGO ONLY.jpg

The "Dual Breakout Strategy" - Trading Rules
The "Dual Breakout" strategy has straightforward trading rules that are easy to implement consistently. With a systematic approach, emotions are removed and discipline enforced. Since the exploration often identifies more opportunities than capital permits, focus is key. The rules help prioritise the best trades.

If the opening bid misses, don't worry
Opportunities abound. Stocks surfing a gap up often stall intraday as momentum fades. Prices may retrace to the original bid and fill the order. Sometimes you miss the trade. It happens. Move on. Unfilled buy orders remain active during the session. They are purged at the close to avoid overpaying tomorrow. Follow two core buy principles:

The "Dual Breakout Strategy" - Buy Rules
1. Buy offers are only valid same day - This ensures that fills are at the desired prices.
2. Execute trades in the listed order - The exploration ranks from top to bottom.
3. Never chase by raising bid prices - Be patient for the right entry.
4. Forget orders not filled during the session - Move on.
5. Do not carry over orders overnight - Tomorrow is a new day.
6. Follow the buy rules without exception - Discipline over emotion.

The "Dual Breakout Strategy" - Sell Rules
1. Never sell without a confirmed signal from the Exploration Analysis - Stick to the system.
2. Always aim to sell in the pre-auction at the bid price identified by the Exploration Analysis - Capturing the opening price is optimal.
3. If unfilled at the open, immediately sell at the market at 10:30am - Don't wait around hoping for a better price.

Follow the sell rules as stated
No exceptions based on emotion or opinion. When closing a position, replace it by purchasing the next top-ranked buy signal from upcoming explorations. This keeps capital fully invested in the highest conviction trades. The strategy rotates positions rapidly, taking profits quickly while entering emerging opportunities. Maintaining 10 active positions is crucial to smoothing equity curves and compounding gains.

Adhering strictly to the sell rules is the key
By "patiently sticking to these rules", you avoid overpaying and focus on high-probability trades. Executing the strategy consistently allows profits to compound over time. Without discretion or second-guessing, allows the strategy's profitable edge to accumulate over time. "Trust the system".

Skate.
 
LOGO ONLY.jpg

The "Dual Breakout Strategy"
This strategy and most that I trade are "trend-following strategies" that require patience as trends can persist for extended periods. Expect some initial pains before the portfolio builds momentum. If you can endure early losses, the advantage of riding winners kicks in. This strategy's mathematical edge takes time to materialise - often months. Early performance may seem slow as trades develop. But this is the nature of systematic strategies.

Starting dates significantly impact results
We can't predict markets, but rigidly following the trading rules maximizes the edge over cycles. Profits come from consistently timing exits, not entries. There will be abundant entry opportunities. The strategy cuts losses quickly while riding profitable trends. Trading is a game of compounding small gains over time. Expect a bumpy start as good and bad days balance out. But stick to the plan without emotion.

Success is never assured
The key is filtering the unavoidable losses and maximising the wins through discipline. Giving the strategy time to work, the law of large numbers can compound gains substantially. Patience and persistence are key.

Skate.
 
More Confessions of a Hobby Trader
Perfectionism has its pluses and minuses in trading. I strive for excellence yet admit to falling short of sky-high expectations. Still, I diligently follow my trading principles and rules, hoping they prove profitable over time.

I'm far from a flawless trader
I've made mistakes, early on I let emotions direct some trades, and deviated from the trading plans. My knowledge can't compete with the "big boys" yet, but adhering to sound practices like appropriate bet sizing, cutting losses quickly, and riding winners has kept me in the game. Trading is a lifelong journey of incremental progress through review and refinement. I now journal trades, analyse performance, and tweak the areas not working. Systems create an edge, but discretionary adjustments are occasionally prudent.

Balance is key
Through ongoing research, risk management vigilance, and consistent execution, my account continues trending up. Trading may be a hobby, but I'm as dedicated as any pro. The path has been bumpy, but persistence and discipline are finally paying off.

There are always harsh lessons to learn
Learning from errors, adapting, and sticking to core principles, I've progressed from novice to viable. The markets remain an intellectual and psychological challenge. But the allure of their puzzles keeps me engaged on the long road ahead.

Skate.
 
LOGO ONLY.jpg

The Dual Breakout Strategy can capitalize on strong trends and ride them for extended periods
Any losing trades will be exited quickly. Successful trading requires patience - profits accumulate over time. There will inevitably be both winning and losing periods. Remain disciplined and stick to the system. Don't make emotional decisions.

CDA - Chart.jpg

All trends start somewhere
The chart shows the system's entry and exit signals to date. In hindsight, other potential entry points are visible. However, it's critical to follow the trading strategy as coded, without second-guessing. Attempting to override the system with discretionary decisions can lead to trouble.

All trends have a starting point that may not be obvious in real-time
Trust in the statistical edge and stick to the rules. The key is consistency over many trades, not any single decision. Discipline and patience allow profits to compound over time. Second-guessing the system invites an emotional and discretionary approach that undermines the strategy's edge.

CDA BUY.jpg

All trends eventually come to an end
The chart above shows the trading signals generated by the "Dual Breakout Strategy" up to this point (September 5, 2023). It's important to keep in mind that no trend lasts forever. Even strong trends that have produced profits will eventually weaken and reverse. Remaining flexible and reacting to changing conditions is crucial.

Exit strategy
As the system identifies a fading trend through its exit signals, it's best to follow those exits rather than hoping for the trend to resume. Exiting doomed trends frees up capital to take advantage of the next opportunity. Trading requires constantly assessing the market with an open mind. What has worked well in the past may not continue working. Accepting that "trends do come to an end" and quickly exiting at the first sign helps protect capital when market conditions shift.

CDA StaleStop Exit.jpg

Profitability is never guaranteed
Proper trade management and exits are crucial for generating profits. While profitability is never assured, this system aims to give you an edge over time. Paper trading the "Dual Breakout Strategy" for at least 6 months should adequately assess its potential before risking real capital. Adhering to a robust strategy can grow your account through compounding gains.

Skate.
 
Ahoy Capn who Skates on Ice

What I cannot comprehend is how you can use the 3% rule on the OPEN in all classes of sail
What you are saying here is a Sail is a Sail is a Sail

Eg a BHP is the same as a PDN or a BMN

That is the same as saying BUY Property Property Proppetry
as if Toorak in Melbourne is the same as Footscray or Bendigo in Victoria

I don't know if you have realized that

The ASX is full of very different weighted Sails and some not so heavy as others
IMHO Your 3% Rule will only work on a very few
and The very best will get away without you

I asked you earlier to put a Market Capitalization on your selections

It fell on deaf ears

What a tried to tell you is that Heavy, Middle and Light weighted sails need to be handled differently on the OPEN

Your 3% Rule won't work on all!

IMHO The Best Ones will alway get away without you!

THIS makes a mockery of ALL Backtesting

What about doing a few hard yards ?

Ocean exercises on all types of Sails
Eg :How many of your Top ten got satisfied on MONDAY on the OPEN
EG ;How many of my 9 URANIUMS would you have got Satisfied on MONDAY on the OPEN

I have not done the exercise but I think you should!

BTW I am a strong Believer and Lover of GREEN CANDLESTICKS
and trade the OPEN 95% of the time
The other 5% unfortunately all usually tend to be bad mistakes
and turn into RED CANDLESTICKS by the end of the day

Salute and Stay Well
XYZ Yacht.GIF
 
@Captain_Chaza, I appreciate you raising this important point about the nuances of using a fixed 3% rule on the open across different classes of stocks. You're correct that a one-size-fits-all approach may not be optimal. The 3% rule works well for me overall, but I acknowledge there could be cases where a more adaptive approach accounting for factors like market cap and volatility would be better.

--------------------------------------------------------------------------------------------------------------------------------------------------------
# Question 1
What I cannot comprehend is how you can use the 3% rule on the OPEN in all classes of sail
@Captain_Chaza, let me answer your question the sequence from previous posts on the subject.

My Answer
My goal is to get filled at the opening price.
My goal is to get filled at the opening price
To accomplish this, the strategy bids 3% above the previous closing price. Using this technique, I'm able to get filled 99.99% of the time. The strategy makes trading simple by automating these complex decisions. But there's some sophisticated logic running under the hood!


--------------------------------------------------------------------------------------------------------------------------------------------------------
# Question 2
That is the same as saying BUY Property Property Proppetry
as if Toorak in Melbourne is the same as Footscray or Bendigo in Victoria

My answer
The "Dual Breakout Strategy" Price filter. The share price must fall between a minumin value of $0.05 and maxium share price of $15.00. Share prices falling outside these values are not considered at all.


--------------------------------------------------------------------------------------------------------------------------------------------------------
# Question 3
I asked you earlier to put a Market Capitalization on your selections It fell on deaf ears

My answer
No, it didn't fall on deaf earsI tried to code this into the Amibroker Exporation Analysis Filter, but my Norgate Silver Subscription level lacks the information. But I did try a few different ways but my coding skill are lacking to accomphlish this for you. I should also say it not included in any of my parameter or filters..


--------------------------------------------------------------------------------------------------------------------------------------------------------
# Question 4
What a tried to tell you is that Heavy, Middle and Light weighted sails need to be handled differently on the OPEN

Your 3% Rule won't work on all!

My answer
The 3% premium to the last closing price works for me.

# Also, Please read what I have written below in an earlier post.
I trade weekly systems where the buy and sell signals are generated after the close on Fridays. I then place those orders in the pre-auction at a 3% premium to the prior close's price, if my "Percentage Up" buy filter is true. If the price gaps up above my 3% premium level, my order won't get filled. I don't chase the price - using this pre-auction strategy with the premium takes the guesswork out of trying to time entries. Even with this approach, there's still a risk my order fails to execute due to a "gap up". Whether the 3% premium secures the open price or not, a buy order not filling has minimal impact on my strategy's overall profitability. I hold 10 positions in the portfolio, so one missed trade won't make or break the performance. The gaps tend to average out over many trades anyway.


--------------------------------------------------------------------------------------------------------------------------------------------------------
# Question 5
IMHO The Best Ones will alway get away without you!

THIS makes a mockery of ALL Backtesting

No, you are incorrect in assuming this. Using my method of placing orders get settled 99.99% of the time. If the price gaps up above my 3% premium level, my order won't get filled. I don't chase the price.


--------------------------------------------------------------------------------------------------------------------------------------------------------
# Question 6
What about doing a few hard yards ?

Ocean exercises on all types of Sails
Eg :How many of your Top ten got satisfied on MONDAY on the OPEN

My answer
100% were settle at my offer price or below. Meaning, with the added 3% premium to the last closing price, all my order got filled.


--------------------------------------------------------------------------------------------------------------------------------------------------------
# Question 7
BTW I am a strong Believer and Lover of GREEN CANDLESTICKS
and trade the OPEN 95% of the time
The other 5% unfortunately all usually tend to be bad mistakes

My Answer
When you have a trading style or system that works, that is the right system for you to trade.


--------------------------------------------------------------------------------------------------------------------------------------------------------
Additional comments
The market is a chaotic and unpredictable place due to the endless amount of information flooding in second-by-second. As a seasoned trader, I know trying to predict the market is futile - instead, I aim to trade the probabilities. I can analyse the markets all I want, but if I don't understand my own trading psychology, it's all for nothing. Without full confidence in my trading plan and strategy, I won't keep pulling the trigger when times get tough, no matter how good I think my system is.

Sticking to my trading plan in a disciplined manner without overriding my system is key. I used to think finding the perfect "holy grail" system was the goal, but I've realized the real key is developing trust in my trading process. If I've backtested a strategy and proven it works, having the discipline to follow it through ups and downs is crucial. Overriding based on emotion is often my downfall.

No system will be perfect, but if I can execute my method with discipline and manage risk, I put the odds in my favour over time. Mastering myself and my behaviours, not finding a magical system, is the true holy grail of trading success. Trading is ultimately a mental game - I need to keep improving to trade to my full potential.

In summary
By sticking to your plan, I think you have just found your “Holy Grail”.

Skate.
 
Top