Australian (ASX) Stock Market Forum

Dump it Here

@qldfrog, I hope others duplicate the "Dual Breakout Strategy" for further evaluation. I'm impressed with the initial result (and I'm not easily impressed) and with a few moving parts the strategy should be easy to replicate for those interested,

Perhaps you could (re-) disclose the rules (and/or Amibroker, RealTest, Wealth-Lab, Zipline or other backtesting platform code) so others can try this out - you might have done so already but it's hard to determine where in 459 pages of a thread at this late hour!
 
Perhaps you could (re-) disclose the rules (and/or Amibroker, RealTest, Wealth-Lab, Zipline or other backtesting platform code) so others can try this out - you might have done so already but it's hard to determine where in 459 pages of a thread at this late hour!

Hi Richard, thank you for taking an interest in this thread the exercise of paper trading is a handy strategy in my opinion, and confirmed by backtesting results.

The original post can be found here

The Dual Breakout Strategy
The core mechanism of the strategy relies on two adaptive components to identify potential emerging uptrends.

1. Support Breakout Trigger
The closing price breaking above the prior 20-period lowest low plus twice the 10-period ATR constitutes a support breakout. This aims to detect upside moves above recently established support zones. The ATR multiplier adapts the trigger threshold to changing volatility - more noise is filtered during high-volatility environments.

2. Trend Filter
An EMA crossover rule requires the faster EMA to be above the closing price before buying. This helps confirm upside momentum and trend direction.

Using both an adaptive support break and trend filter in tandem seeks to improve timing and reduce whipsaws compared to more rigid breakout methods. The dual criteria aim to capitalise on upside moves as early as possible, while still maintaining some noise filtering. The breakout factor and EMA lengths have been optimized through a walk-forward analysis across different indexes.

I also provided a 5-year backtests indicating win rates, profit factors, drawdowns, and a short self-evaluation of the results. This IMHO provides evidence that the adaptive logic consistently improves performance across changing market conditions compared to simple moving average crossovers or fixed non-adaptive breakout variants.

The "Dual Breakout Strategy" Backtest results can be found here

In summary
The dual breakout technique proposes an intriguing concept combining dynamic support and trend analysis. However, further backtest metrics and benchmarking against other approaches would help quantify the potential advantages. The general framework appears sound.

Skate.
 
This is a shorter Backtest of the "Dual Breakout Strategy"
The Backtest period is from the 1st of January 2020 to the 31st of August 2023. This period displays how it handled the COVID-19 flash crash and the quick hockey stick recovery. 2022 was a struggle for most trend traders and the backtest captures how this strategy handled this period/

Here is my self-evaluation of the backtest results shown below
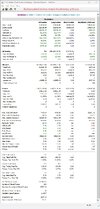
The backtest performance for the Dual Breakout Strategy over the period 1/1/2020 to 31/8/2023 looks quite strong. The backtest metric is not that shabby either with a 422% return over 3 years and 8 months. The risk-adjusted returns are also impressive, with a Sharpe ratio of 0.6 and an Ulcer Performance Index of 13.19.

The high-profit factor of 3.18 and payoff ratio of 3.42 indicate the strategy is consistently profitable, with average wins significantly larger than average losses. 48% of trades were profitable, with average win/loss ratios of 3.4. The largest winning trade was over 11X bigger than the largest loss.

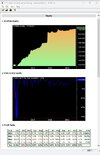
Max drawdown was a moderate 20.6%, but higher than expected and the Ulcer Index of 3.9 suggests volatility of returns was not too extreme. Recovery factors and return/drawdown ratios were very high, pointing to quick rebounds from any drawdowns. The exposure of 29% indicates the strategy is not over-trading and risk is reasonably controlled. Overall equity growth appears consistent over time, with no major blow-ups.

Based on these backtest metrics alone, the dual breakout approach appears quite robust and promising. The combination of dynamic support/trend analysis seems effective in identifying emerging uptrends across various market conditions. The results are certainly intriguing and if paper trading can replicate the backtest results, this strategy will move to live trading.

Top ONLY.jpg

BACK ONLY.jpg
Skate.
 
This appears to be a good system from this data set. Would be interesting to run it in periods beyond this.

Since this is a paper exercise, are you able to provide your AmiBroker code for others to replicate your system and provide feedback/tweaks/suggestions for possible improvements?
 
This appears to be a good system from this data set. Would be interesting to run it in periods beyond this.

Since this is a paper exercise, are you able to provide your AmiBroker code for others to replicate your system and provide feedback/tweaks/suggestions for possible improvements?

Richard, thank you for your interest in the "Dual Breakout Weekly Trading Strategy". While I'm unable to share the exact AmiBroker code, I'm happy to provide some additional details to help you code a similar strategy without disclosing the proprietary code.

The Dual Breakout Strategy buy signals have multiple conditional requirements:
(a) A price breakout above recent support determined by the lowest low of the past 20 bars plus a volatility metric. This identifies potential breakouts with momentum.
(b) The Percentage Up index filters gauge market health and bullish/bearish bias. Breakouts must align with overall trends.
Requiring all conditions creates precise setups and reduces whipsaws.
(c) Custom filters check volume, liquidity, and overall market conditions. Stocks must pass all the filters to generate a buy signal.

In English
The "Dual Breakout Strategy" identifies high-probability entries during emerging uptrends in quality stocks. The core buy logic utilises an adaptive support breakout technique to identify emerging uptrends early. Specifically, it looks for the closing price to break above the prior 20-bar lowest low plus twice the 10-bar Average True Range (ATR). This dynamic mechanism aims to detect closing prices breaking out above recently established support levels, signaling a potential new uptrend.

The ATR multiplier adapts the support breakout trigger to changing volatility conditions - requiring wider breaks during volatile markets and smaller breaks in calm conditions. This makes the system more robust across various environments compared to fixed non-adaptive approaches.

A faster exponential moving average (EMA) crossover adds trend confirmation. Buying only occurs if the faster EMA is above the closing price, indicating bullish momentum aligning with the support breakout.

Together, the adaptive support breakout and momentum filter identify significant upside breakouts with momentum early in emerging uptrends. This dual mechanism seeks to capitalise on new uptrends quickly after periods of consolidation.

The straightforward logic, dynamic adaptive capability, and backtested results demonstrate the promise of this type of systematic trend-following breakout strategy. Proper risk management like trailing stops, stale stops, and a take profit stop are also incorporated into the strategy.

Just to be clear, even with both buy conditions being true all the other filters and parameters have to agree to generate signals. The Dual Breakout Strategy is a systematic approach that uses Amibroker to test combinations of technical indicators and custom filters. It aims to identify emerging trends early while avoiding false breakouts.

The strategy enters up to 10 equal-weighted positions upon precise buy signals. Trades are managed with pre-determined exits like "stale stops", "trailing stops" and "profit targets" and everything about this strategy depends on the "Percentage Up" buy timing filter. With a defined set of trading rules hopefully, it will maximise profits, and minimise losses.

The percentage UP filter is a great example of a straightforward approach that I've found to be effective in my trading.

The main advantages of using a simple "Percentage Up" filter are:
1. It's easy to understand and implement.
2. No complex formulas are required.
3. It adapts to the volatility of the market.
4. It avoids over-optimization.
5. Too many complex buy filters can lead to curve-fitting, one is enough.
5. The "Percentage Up" filter is nothing more than a buy "timing filter"

Skate.
 
With all due respect:

With @Joe Blow's approval, I think this thread could provide a transparent case study.

Without provided code it's not really transparent.

Many users have different backtesting platforms, so providng your code would be useful to port it to those environments and backtest it against their own survivorship bias-free data sets, and might also be useful for testing against different markets too.
 
Last edited:
With all due respect:


Without provided code it's not really transparent.

Richard, I appreciate you bringing up the need for transparency. This exercise aims to take a strategy from backtesting to paper trading in real-time, and transparency of signals and ongoing results is crucial.

While I have not provided the full coding details, I have outlined the entry and exit conditions, explained how the buy conditions interact with the Percent Up Filter, and shared my overarching trading plan. The backtesting and strategy development were done separately, and this paper trading exercise focuses on executing the strategy live.

Once the strategy is active, the transparency will be clear - all signals and performance metrics will be shown in real time before entries are made. This process intends to evaluate the strategy. Please let me know if any aspect remains unclear. I'm happy to provide additional details to ensure full transparency as the exercise unfolds. My goal is for this to be an open and educational process.

Skate
 
LOGO ONLY.jpg

@Richard Dale, to conclude, this paper trading exercise is intended purely as an educational demonstration - it is not a signal service or any kind of recommendation. The core goal is complete transparency regarding my real-world performance versus backtested simulations.

By documenting this process in detail, I hope to illustrate the practical adjustments required when transitioning from theoretical backtesting to live trading. Tracking my paper trading results in real-time can shed valuable light on how real-world execution impacts returns compared to idealised backtests.

I believe readers could gain tremendous insight into my process of developing conceptual strategies into practical, executable trading systems. I welcome any suggestions on making this exercise as educational and transparent as possible. My aim is to provide an inside look at how I execute trades, implement risk management, and account for real-world factors like slippage and commissions that affect bottom-line results.

The key takeaway is that paper trading performance often differs substantially from backtests. By sharing this experience in real-time, traders can understand the on-the-ground realities I face in implementing a strategy successfully. This exercise is not intended to provide or endorse any tradable signals.

My goal is an open-book evaluation of how trading systems hold up in live market conditions. The more transparent and detailed I can make this demonstration, the more it will assist readers in their own development as traders. My hope is traders can use this as a template for rigorously evaluating their own systems. Please feel free to provide additional perspectives on maximising the educational value of this exercise.

Skate.
 
The metrics in your backtest report are incongruous with your reported trading rules and the reported drawdowns are extremely unusual for a breakout trading system.

I suspect a coding error or other bias error in your backtest.

Your buy & hold stats don't appear to be correct (it should be a 10.3% return on $XAO.au). Also, you should also be using Buy & Hold on $XAOA.au to incorporate dividends which would show more like a 26.5% return on that time period.

So, I again encourage you to post the code.

Richard thank you for your feedback. I appreciate you taking the time to review my backtest report thoroughly. You raise some good points that I will need to look into further.

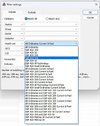
Regarding the buy & hold returns, you are correct that I should be using the XAOA index to incorporate dividends. I would redo that analysis to provide a more accurate benchmark if I had the ASX All Ordinaries Total Return Index in the "Filter" for selection

As for the other metrics and drawdowns, I will recheck my code and data for any errors or biases that could be leading to unusual results. Coding errors are easy to make, so your suspicion may be valid. I will do my due diligence to ensure the backtest faithfully represents the strategy logic.

My goal is to have an accurate backtest that allows an informed evaluation of the strategy. Your comments will help me improve it. I appreciate you taking the time to provide thoughtful feedback.

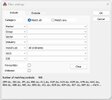
Current filter settings

Filter Settings.jpg

Skate.
 
Skate,

Your screenshot there is not showing any delisted stocks, so there's a clue of a serious issue.

I'm guessing at one stage you were subscribed to Norgate Data's AU Stocks Platinum package (which provided delisted stocks and historical index constituents) but now subscribe at a lower level, so there are no longer any delisted stocks in your database, and there's no information on past index constituency dates provided too.

Therefore I think you've got serious survivorship biases in your backtest.

Not much point looking at paper trading until that is resolved.\

(I'm also having a look at the behaviour in AmiBroker of downgrading from Platinum to Gold or Silver level - we might need to consider a way of "blanking out" those Current & Past watchlists to prevent this from happening in the future)

Richard, you make an excellent observation about the lack of delisted stocks in my backtest results. I did previously have access to delisted data through Norgate's Platinum package, so you are likely correct that I now have a survivorship bias after switching to a lower Silver subscription level. Thank you for catching this major oversight on my part.

You're also right that there's no point in continuing paper trading without fixing this issue first. I clearly need the historical index constituent data to avoid selection and survival biases. I may upgrade my Norgate subscription again to regain access to the delisted stock data at the next renewal date.

I really appreciate you taking the time to thoroughly review my backtest and identify this shortcoming. It would have invalidated any strategy results. I will halt my current backtesting and paper trading exercise focusing on getting the proper data to avoid these biases going forward. Your expertise in this area is invaluable.

Skate.
 
4. It avoids over-optimization.
What do you mean by this?

It took me over 20 years to find out that this is all BULLTISH and Wrong
Very Very Wrong!

Are you saying
"Sell the Good Ones and don't let the Good Ones RUN"

Hopefully you are Not suggesting to the beginners
"Average UP/DOWN on the Baddies to have a more BALANCED Trousseau of Sail?"


Salute to You Capn Skates
I like the way you are heading
HMAS  Ship of Fools.gif
 
4. It avoids over-optimization. What do you mean by this?

Captain, I was explaining the advantages of having "one" buy filter. The "Percentage Up" filter is a great example of a straightforward approach that I've found to be effective in my trading. Over-optimization refers to making a strategy overly complex. In summary, the "percentage up" buy filter aligns well with a simple principle, of only buying positions when the majority of the individual constituent (50% and Over) in the index is advancing.

The main advantages of using a simple "Percentage Up" filter are:
1. It's easy to understand and implement.
2. No complex formulas are required.
3. It adapts to the volatility of the market.
# 4. It avoids over-optimization.
# 5. Too many complex buy filters can lead to curve-fitting, one is enough.
# 6. The "Percentage Up" filter is nothing more than a buy "timing filter"

The "Percentage Up" conditional buy filter is at the heart of the "Dual Breakout Strategy" and will only generate buy signals if the percentage of positions in the (XAO) watchlist that are in an uptrend, that is greater than 50% within the index.

Skate.
 
I think you've got serious survivorship biases in your backtest. Not much point looking at paper trading until that is resolved.
The Value of Flawed Backtests
I recently went through an enlightening experience developing a trading strategy. Using AmiBroker and historical data from Norgate, I backtested a "Dual Breakout" system that appeared very promising on paper. However, when I shared the results, Richard from Norgate identified major flaws like survivorship bias and coding errors that invalidated the backtest.

Originally, I decided to halt my paper trading of the strategy until I could fix the data issues and re-run the backtests properly. However, upon further reflection, I realised there is value in proceeding with the paper trading as-is. Even though the backtest results are biased, paper trading the flawed strategy can still provide an important educational lesson.

When I do paper trade this system, I expect the performance will differ significantly from the backtest results. This discrepancy will vividly demonstrate how subtleties like data biases can lead to misleading backtest results. The exercise will reinforce the importance of ensuring data integrity and transparency in system development.

So rather than scrapping this project, I've decided to use it as a case study in backtest diagnostics. By comparing the biased backtest results to the "real world" paper trading outcomes, I hope to gain deeper insight into how sensitive trading strategies are to data quality issues. I can then use this knowledge to build more robust systems less likely to succumb to data errors and biases.

In summary, backtests don't need to be perfect to provide value. Even flawed backtests can reveal useful lessons about strategy robustness through paper trading. While I'm still grateful to Richard for identifying the issues, I now see this as an opportunity to better educate myself rather than a failure. My mistakes will make me a more careful, diligent trader and system developer moving forward.

Skate.
 
The Dangers of Overconfidence in Trading Strategies
In my last post, I shared details of a trading strategy I had developed and backtested called the "Dual Breakout Strategy". The initial results looked fantastic, showing high returns with low drawdowns over a 10+ year backtest period. However, @Richard Dale astutely pointed out, there were major flaws in my methodology:

1. Survivorship bias
My backtest only included surviving stocks, not those that had been delisted over the years. This artificially inflated the performance. As Richard from Norgate Data noted, I need to include delisted stock data to avoid this bias.

2. Coding errors
Discrepancies between my stated rules and backtest results raised suspicions of bugs in my AmiBroker code. Without sharing the code, it was impossible for others to validate the results.

3. Incorrect benchmarks

My buy-and-hold benchmark calculations failed to include dividends, further calling my strategy's outperformance into question.

Backtests can be misleading if not constructed carefully
I want to thank Richard who spotted these issues and brought them to my attention. It's a sobering reminder of how easy it is to fool oneself into thinking a trading strategy is viable when the underlying data and methodology contain flaws. Access to accurate, bias-free data is crucial. Benchmark calculations must be done diligently to allow for fair performance comparisons. And code should be shared so others can replicate and validate results.

The bottom line
I clearly got ahead of myself in touting the supposed merits of this strategy.

Skate.
 
Learning from Imperfect Backtests Through Paper Trading
In my previous posts, I described a trading strategy backtest that appeared quite profitable but contained major flaws like survivorship bias and coding errors @Richard Dale pointed out.

While the backtest was clearly flawed
I don't believe the exercise was without merit. Imperfect backtests can still reveal useful lessons about a strategy's robustness through paper trading. Rather than scrapping the strategy entirely, I plan to continue with the "paper trading" exercise, while tracking the issues that arise. This will allow me to directly observe how the flaws impact real-time performance. I can tweak the strategy's rules and refine my coding along the way.

The goal is not to prove the strategy works perfectly
Quite the opposite. I expect it will underperform, and watching it "crash and burn" under real market conditions will provide an important lesson in position sizing and expectation management.

Not all valuable trading insights require pristine data and error-free code
Useful knowledge can be gained by trading a flawed system, as long as we're aware of the limitations and monitor the results through a "paper trading" approach. I'm excited to learn from this experiment and share my experience trading a demonstrably imperfect strategy.

Skate.
 
Reassessing Trading Strategies Through Paper Trading
I want to acknowledge upfront that the trading systems I've developed and traded over the past 8 years were based on using Norgate's Platinum Data. However, as of May 3rd, 2023, I downgraded to Norgate's Silver Subscription, which lacks some of the critical data needed for robust backtesting. As a result, any backtests I've posted since then are unreliable.

This experience has reinforced that trading inherently involves substantial risk
No matter how confident you may be in a trading strategy or your abilities as a trader, it's critical to take action when you see significant losses accumulating. I have been trading weekly systems without any manual interference since 2015. However, for the sake of an educational "paper trading" exercise, I will explain the process I would follow for taking the buy and sell signals:

The system triggers signals "after the close" each Friday
In real trading, these signals would be placed in the pre-auction at the offer price, with a 3% premium above Friday's closing price. However, since this is just a paper trading exercise, the trades will be simulated rather than actually executed. The goal is to see how the signals would have performed if traded according to the plan.

The point is not to prove this is a profitable strategy
Given the data limitations, I expect the paper trading to show substantial losses. However, there is still value in closely tracking and learning from a flawed system. I look forward to sharing what insights I gain from this educational process.

Skate.
 
Paper Trading.jpg
10-position $100k portfolio ($10k positions)

Today marks the beginning of my paper trading exercise
I will be uploading the raw trading signals from Amibroker Exploration as well as backtests using Amibroker's Portfolio Reporting. All progress tracking and reporting will be done through "Share Trade Tracker". The reports will be self-explanatory and will need no additional commentary. Each week I will include an equity line chart to visualize the performance of the "Dual Breakout Strategy" over time.

The goal is to get hands-on practice executing signals in a simulated environment
By paper trading, we can evaluate how this system might perform with real capital before risking actual funds. I look forward to analysing the results.

The paper trading exercise commences
Timing is a critical component of trading success. Entering positions at opportune moments allows traders to ride market uptrends and avoid downturns. However, timing the markets flawlessly is enormously difficult, if not impossible. Perfect timing is unlikely. Markets fluctuate unpredictably, and mistakes do happen.

XAO.jpg


The PercentageUp Filter: A Valuable Timing Tool

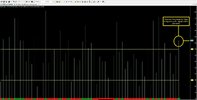
The PercentageUp Filter is a timing indicator that I have found highly correlated with the broader Australian market, as represented by the ASX All Ordinaries index. This filter gauges bullish or bearish conditions based on the percentage of constituent stocks trading above a set level. Specifically, the filter signals bullish markets when over 50% of stocks are above the threshold, at which point the "Dual Breakout Strategy" will generate new long positions. Bearish signals emerge when fewer than 25% of stocks are above the level, prompting exits from existing long positions.

The PercentageUp Filter serves as an insightful barometer of market sentiment and trend
By adhering to its signals, I aim to time entries and exits advantageously, capitalising on upswings and dodging downturns. While no timing tool is foolproof, I have found the filter to be a valuable addition to my systematic trading approach in the Australian market. It helps align my strategy with prevailing conditions for greater consistency.


Percentage Up Filter .jpg


Amibroker Exploration Analysis

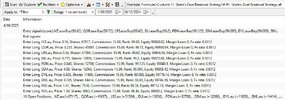
Below are the first 10 raw trading signals generated from the Amibroker Exploration Analysis. For each signal, I have included the ASX stock code, the number of shares to buy, and the purchase price based on the pre-auction offer. The position sizes are calculated to keep each initial investment under $10k including commission costs.

While this initial strategy is still being refined due to its flawed methodology
The process mirrors my live trading approach. I use Amibroker to scan for stocks meeting my criteria, determine position sizing based on risk management rules, and place the orders in the pre-auction over the weekend. Tracking these paper trades will allow me to evaluate and enhance the strategy.

Week 1 - Exporation Raw Signals.jpg


Backtest Portfolio Signals
Shown below are the trading signals generated through Amibroker's Backtest portfolio function. While I utilise this feature to analyse strategy performance, I do not actually trade using these retrospective signals.

Backtesting has inherent limitations for real-world trading
Hypothetical simulated trades cannot account for all market complexities or replicate emotional decision-making. As such, I find it more prudent to trade based on "Exploration Analysis" results rather than backtested signals.

Backtesting remains a valuable tool for strategy development and statistical analysis
The key is recognising its limitations and maximising its utility through paper trading and forward testing. While I may refine systems using historical data, I ultimately rely on live market scans to execute my trades. This approach helps align strategy development with practical execution.

In summary
These backtest portfolio signals are for analytical purposes only. My live trading process utilises "Amibroker's Exploration Analysis" rather than backtesting, which I find more reflective of real market dynamics. This distinction is important for interpreting the results and signals presented.

Week 1 - backtest Signals.jpg


Closing Thoughts
Firstly, thank you for following along this far in my initial post, which aims to provide context and background for the paper trading process. While exhaustive, establishing this foundation now will streamline future weekly updates.

Moving forward, the reporting will be much more concise
The reporting will be focused purely on the paper trading results and equity curve visualization. I will let the numbers and performance metrics speak for themselves without lengthy commentary.

My goal is to make the weekly updates clean and efficient to analyse
The core of this exercise is to observe the paper trading data rather than a running commentary. I appreciate you bearing with the lengthy first post the forthcoming reports will be far more compact and reader-friendly.

Looking ahead
I am eager to commence paper trading and start generating results to assess this strategy. Thank you for your interest thus far, and I welcome any feedback for improving this educational initiative as it unfolds. Otherwise, let the trading commence. I look forward to next week's update showcasing the first week's paper trading activity.

Skate.
 
Top