Australian (ASX) Stock Market Forum

Dump it Here

You don't necessarily need different systems, markets or instruments to lower drawdowns, although I do agree that different system styles can certainly make it easier.

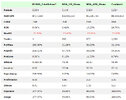
Here are two monthly momentum strategies, one traded on the ASX and one traded in the US.
50/50 allocation.
Long only equities.
sys-1.jpg

On the surface, combined, they perform extremely favourably compared to the benchmark.

Looking under the hood, the correlations, both returns and drawdowns, are also extremely favourable.
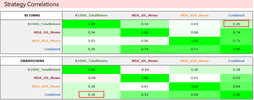
sys-2.jpg
 
The markets changed enormously after covid. Simple swing system, simply broken! I'll keep track of it, but who would trade this when it's flat for 3 years?

It trades big cap ASX, has no index filters. I've noticed the speccies also move very differently since 2020.

When I zoom in, the whole thing changed right at the end of the FY 2020.


x.png
 
Last edited:
The markets changed enormously after covid. Simple swing system, simply broken! I'll keep track of it, but who would trade this when it's flat for 3 years?

It trades big cap ASX, has no index filters. I've noticed the speccies also move very differently since 2020.

When I zoom in, the whole thing changed right at the end of the FY 2020.


View attachment 152061

Is it fair to say the system is broken? All systems have their limitations and I doubt any single system will perform well in all market conditions.

I stray into another area of interest to me, but I've often thought that system backtesting would benefit immensely if you could generate some random market data (not actual market data) that modelled certain user defined market behavior (certain volatility, liquidity, sideways, flashcrashes etc) and you could backtest your system on that random data to get better insight into how your system might perform across a broad range of user definable market behaviors. Everyone uses real market data to test their systems and while that is great it doesn't tell you how your system will behave if the real market starts behaving in a manner it hasn't done so before but with user defined random data it may well be possible to see your system's behavior in conditions that haven't yet played out in the real market.
 
Good evening all. I was wondering if I could have your thoughts on the following "too good to be true" scenario:

Let's say I have a trading system coded up in Amibroker, it trades the russell 3000 and makes a lot of trades (up to 20 stocks per day).
I run a backtest for the last x amount of years, then I sort by profitability. I select only the profitable trades, then "add selected results to watch list". We'll call this watch list "profitable stocks". From now on, I only trade the stocks on this watch list. Maybe I update the list every so often. With this watchlist I get backtest results of ~50% CAGR, max DD 8%.
Surely it can't remain at such high profitability over the long term right? Or can it?
 
It may work...until it no longer does. No one can see into the future but plenty think they can - witness the endless bottomless pit of trading books and websites available.
A few thoughts...
You have created your own trading universe using known previously trending/profitable stocks.
1. Did your backtest allow for survivorship bias? A Norgate Platinum subscription required, see Norgate website on historical index constituents plus Amibroker function. Known to kill a lot of promising systems.
2. Have you included walk forward testing using OOS data? See https://www.amibroker.com/guide/h_walkforward.html

Here's the IBD200 filter scan .afl for building a momentum universe - similar but different, it filters on strong momentum stocks.
//IBD200 Relative Strength Scan
//The formula combines Price Percent Change formulas for 3-Months, 6-Months, 9-Months and 12-Months (in that order)
//with double weight being placed on the 3-Month component. Daily version.
IBD200 = ((0.4 * (C - Ref(C,-65))/Ref(C,-65)) + (0.2 * (C - Ref(C,-130))/Ref(C,-130)) + (0.2 * (C - Ref(C,-195))/Ref(C,-195)) + (0.2 * (C - Ref(C,-260))/Ref(C,-260)))*100;

Simpler to use ROC, I think this will give the same outcome, I haven't checked.
IBD200 = ((0.4 * ROC(C,65)) + (0.2 * ROC(C,130)) + (0.2 * ROC(C,190)) + (0.2 * ROC(C,260)))*100;

Cheers.
 
Good evening all. I was wondering if I could have your thoughts on the following "too good to be true" scenario:

Let's say I have a trading system coded up in Amibroker, it trades the russell 3000 and makes a lot of trades (up to 20 stocks per day).
I run a backtest for the last x amount of years, then I sort by profitability. I select only the profitable trades, then "add selected results to watch list". We'll call this watch list "profitable stocks". From now on, I only trade the stocks on this watch list. Maybe I update the list every so often. With this watchlist I get backtest results of ~50% CAGR, max DD 8%.
Surely it can't remain at such high profitability over the long term right? Or can it?

Highly unlikely.

Screen Shot 2023-02-02 at 8.06.29 AM.png

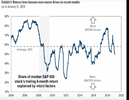
Endless studies demonstrate that the following drive returns: Market/Sector/Stock. The above study is from Goldman Sachs.

In 'normal' times, ie. no panics etc. stocks correlate +/- 50% to what the market is doing. In times of stress that jumps higher to 80%+

jog on
duc
 
With this watchlist I get backtest results of ~50% CAGR, max DD 8%.
What's that saying....if it sounds too good to be true it probably is too good to be true. If you're DD was around 40/50% I'd think...hmmm maybe, but doubt it very much with only an 8% DD
 
I'm asking for a small favour from somebody with Norgate Platinum.

/////////////////

PositionScore = Ref(C, -1) / Ref(C, -250);
MaxPos = 10;

SetOption("InitialEquity", 100000);
SetOption("MaxOpenPositions", MaxPos);
SetPositionSize( 100/MaxPos, spsPercentOfEquity);//
SetOption("CommissionMode", 2);
SetOption("CommissionAmount", 0); // set to zero commission for a reason
SetOption( "ExtraColumnsLocation", 1 );

SetTradeDelays (1,1,1,1);

Buy = [ Norgate ASX100 ];

BuyPrice = C ;

Sell = 0 ;
SellPrice = C ;

hodl = Optimize("hold", 20, 15, 25, 1); // hold number of days

ApplyStop(stopTypeNBar, stopModeBars, hodl, exitatstop = 0);

//////////////////

This is a very primitive kind of, sort of, not really, rotational trading system that outperforms an index fund and is still quite scalable, trading only ASX100 stocks. It buys the top ranked stocks and holds for a fixed number of days. Then it sells them and buys the top ones again. In reality, and with a proper Rotational trading system, there is usually no need to sell any because of the long lookback of the ranking method, hence very little brokerage.

What I don't know is how this would have performed over 20+ years. My ASX100 lists only go back to 2011.

This was all inspired by @Willzy last year in this thread. He was getting much better results than this.

Screenshot 2023-02-03 140747.jpg

1675394957853.jpeg


What I'm asking for is one backtest and one optimize run as above starting in 2000 or so.
Thanks

Maybe I shouldn't clutter up Skate's thread with this, but he has been very quiet lately.
 
Last edited:
Good evening all. I was wondering if I could have your thoughts on the following "too good to be true" scenario:

Let's say I have a trading system coded up in Amibroker, it trades the russell 3000 and makes a lot of trades (up to 20 stocks per day).
I run a backtest for the last x amount of years, then I sort by profitability. I select only the profitable trades, then "add selected results to watch list". We'll call this watch list "profitable stocks". From now on, I only trade the stocks on this watch list. Maybe I update the list every so often. With this watchlist I get backtest results of ~50% CAGR, max DD 8%.
Surely it can't remain at such high profitability over the long term right? Or can it?
Definitely not. What you're doing is no different to identifying a single high performing stock over the past 20 years (say, Tesla) and expecting that it must continue.
 
It may work...until it no longer does. No one can see into the future but plenty think they can - witness the endless bottomless pit of trading books and websites available.
A few thoughts...
You have created your own trading universe using known previously trending/profitable stocks.
1. Did your backtest allow for survivorship bias? A Norgate Platinum subscription required, see Norgate website on historical index constituents plus Amibroker function. Known to kill a lot of promising systems.
2. Have you included walk forward testing using OOS data? See https://www.amibroker.com/guide/h_walkforward.html

Here's the IBD200 filter scan .afl for building a momentum universe - similar but different, it filters on strong momentum stocks.
//IBD200 Relative Strength Scan
//The formula combines Price Percent Change formulas for 3-Months, 6-Months, 9-Months and 12-Months (in that order)
//with double weight being placed on the 3-Month component. Daily version.
IBD200 = ((0.4 * (C - Ref(C,-65))/Ref(C,-65)) + (0.2 * (C - Ref(C,-130))/Ref(C,-130)) + (0.2 * (C - Ref(C,-195))/Ref(C,-195)) + (0.2 * (C - Ref(C,-260))/Ref(C,-260)))*100;

Simpler to use ROC, I think this will give the same outcome, I haven't checked.
IBD200 = ((0.4 * ROC(C,65)) + (0.2 * ROC(C,130)) + (0.2 * ROC(C,190)) + (0.2 * ROC(C,260)))*100;

Cheers.

Highly unlikely.

View attachment 152508

Endless studies demonstrate that the following drive returns: Market/Sector/Stock. The above study is from Goldman Sachs.

In 'normal' times, ie. no panics etc. stocks correlate +/- 50% to what the market is doing. In times of stress that jumps higher to 80%+

jog on
duc

What's that saying....if it sounds too good to be true it probably is too good to be true. If you're DD was around 40/50% I'd think...hmmm maybe, but doubt it very much with only an 8% DD

Definitely not. What you're doing is no different to identifying a single high performing stock over the past 20 years (say, Tesla) and expecting that it must continue.
Thanks all for your thoughtful responses. I have Norgate platinum for USA EOD data, I'm going to run a few 6 year backtests (2011 - 2016, 2012 - 2017, 2013 - 2018 etc), making watchlists with all the profitable trades, then will use those watchlists to run a backtest on the following 12 month period. I'll let you know how it goes.
 
Thanks all for your thoughtful responses. I have Norgate platinum for USA EOD data, I'm going to run a few 6 year backtests (2011 - 2016, 2012 - 2017, 2013 - 2018 etc), making watchlists with all the profitable trades, then will use those watchlists to run a backtest on the following 12 month period. I'll let you know how it goes.
I think I did this a long time ago and it didn't work, but I'm interested to see what you get.

Another option would be run AB's "individual optimize". Some stocks have very specific ways of trading. eg. there are some which never make money with an MR approach in their entire history. Why include them in real MR trading strategy? Makes absolutely no sense.
Tomasz actually included the "individual optimize" feature at my request! It takes a long time to run it - that's the only problem.
The idea would be run IO across say 100 stocks for the period 2015-2019. Use a max of 2 optimization variables, preferably one. Take the top 20 stocks (ranked by whatever factor you normally use, say it's Sharpe ratio). Now use the optimized parameters in each of these stocks for 2020-2023.
 
Some here would be members of futures io.

They're doing a webinar tonight: "Backtesting Sucks! Learn how to actually enjoy the process".
 
Everything ok with Skate? Strange not getting the regular notifications of a new post from him within the thread to take a look at. Hopefully enjoying some well earned time away from the screen, maybe somewhere tropical.
I have recently been talking with Skate.
I will say is that “Skate is busy but OK”.
Cheers.
DrB
 
Top