Australian (ASX) Stock Market Forum

Dump it Here

Systematic trading
They tell us everything can be answered by mathematics. The answer to the "Ultimate Question of Life, the Universe, & everything else" is (42) but unfortunately, no one knows what the question was.

The issue I have with trading systematically
Is that I'm dealing with Human Nature, logical people making illogical decisions. I also believe the market is driven more by FEAR than anything else. Combine the last few posts & it becomes clearer why trading has been turned on its head since February 2020.

Skate.
 
Monthly trading won't work, will it?
There are so many ways to trade & just as many time frames to trade in. First off, I should make a disclaimer that I prefer to trade weekly strategies over any other periodicity. Why? for the many reasons I've outlined in a multitude of previous posts.

Well blow me down
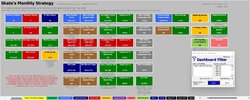
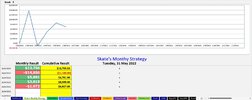
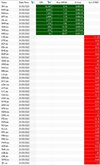
The exercise at the moment trading three strategies live being the (Platinum, Flying Bat & Monthly Strategy) only one of these is in profit after 22 weeks. You guessed correctly, it's the Monthly Strategy. I don't mind trading my new strategies live on the thread as an exercise because over a short period they will either make a few bob or lose a few, either way, it's irrelevant to my trading.

What do I know?
I knew for certain trading a "Monthly Strategy" wouldn't work or be profitable over a short time frame but at the moment it proving me wrong.

What I do know
I shouldn't jump to a conclusion without knowing all the facts. I also know "Beetle do fart".

Skate.
 
It's hard to keep up with the markets
There has been some interesting banter in "the-official-asx-is-tanking-panic-thread" that goes to the very heart of trading. We all speak of bear & bull markets but rarely can pinpoint them accurately in the heat of trading. There are some experienced fundamental traders who tend to have the ability to discern the information accurately. Their conviction speaks volumes. Then there are those who use mathematics to calculate the market pivots using those to decide when to enter & exit a position, a combination of learned experience & gut feelings. Then there are system traders relying on pure mathematics.


Skate.

When bull markets, bear markets are discussed in context of fundamentals, what should be discussed are the big macro ideas and situation. This can largely be done quickly in a chart based format. These macros tend to move slowly, thereby (generally) providing plenty of time to prepare. The issue is more about being early than late.

One of the above is of course the Central Banks. Central Banks are political. Their monetary policies lead the political agenda of the current regime.

Markets will often adjust before Central Banks adjust monetary policy, particularly very large players who require lots of liquidity to enter/exit. Their footprints are seen in advance/decline charts.

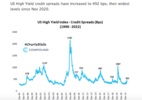
The Bond market will usually lead stocks, starting with long duration end of the curve. Yield curves are important information as are credit spreads.

Screen Shot 2022-05-27 at 1.28.16 AM.png

The issue with credit spreads is that it signals a contraction of liquidity. Markets of today, more than yesteryear are 'X' times more susceptible to contracting liquidity. This is because the derivatives markets are so much larger. The current derivatives market is $1.4Quadrillion in size. Of that number close to 60% are SWAPS. SWAPS are private market, unregulated, blind, contracts that settle in CASH. Given that the base money supply M2 is a fraction of the derivative market, never mind the cash requirements of everything else, and you can see it doesn't take much for a credit crunch to morph into a liquidity event.

Screen Shot 2022-05-29 at 7.56.39 AM.png

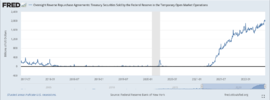
Currently the commercial banks are seeking to earn a pittance on overnight loans to the Fed. That is now $2T/night. Banks are holding or hoarding cash. Why? Because as the Fed shrinks its Balance Sheet, cash will become the only thing that protects them from a liquidity event...and the Fed steps back in. Or not, think LEH.

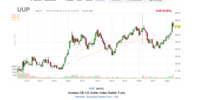
Another way of looking at liquidity is demand for the dollar:

Screen Shot 2022-05-29 at 8.04.36 AM.png

This bear for stocks only changes when the Fed capitulates and adds back (huge) liquidity. The issue then becomes a dollar survival issue.

The point being: to call big stock market conditions (bull/bear) requires looking not only at the stock market. Currencies, interest rates (credit spreads) commodities (inflation) and bond markets are all necessary inputs.

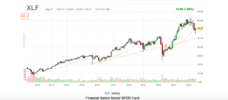
Then look at the major segments of the market. Financials are a good one. You can never have a bull market unless the financials come to the party. Also, conversely, when the financials (banks etc) are weak, the market is weak.

Screen Shot 2022-05-29 at 8.18.25 AM.png

The writing was on the wall at the start of the year. This next chart echoes what @peter2 and @Skate have been saying about relative strength, just on a macro level:

Screen Shot 2022-05-29 at 8.20.44 AM.png

You can also look at discretionary v staples.


Currently we have another bear market rally. It will fail by the end of next week.

Why?

Because the Fed is still hawkish in their rhetoric. Until that changes, markets remain in bear mode as the Fed reduces liquidity. When they trigger the liquidity event and markets shed another 40%+, they will (late again) try to salvage the crisis. They are a 1 trick pony. Flood the markets with liquidity. That has been their only policy response since Greenspan in 1987.

jog on
duc
 
When bull markets, bear markets are discussed in context of fundamentals, what should be discussed are the big macro ideas and situation. This can largely be done quickly in a chart based format. These macros tend to move slowly, thereby (generally) providing plenty of time to prepare. The issue is more about being early than late.

One of the above is of course the Central Banks. Central Banks are political. Their monetary policies lead the political agenda of the current regime.

Markets will often adjust before Central Banks adjust monetary policy, particularly very large players who require lots of liquidity to enter/exit. Their footprints are seen in advance/decline charts.

The Bond market will usually lead stocks, starting with long duration end of the curve. Yield curves are important information as are credit spreads.

View attachment 142284

The issue with credit spreads is that it signals a contraction of liquidity. Markets of today, more than yesteryear are 'X' times more susceptible to contracting liquidity. This is because the derivatives markets are so much larger. The current derivatives market is $1.4Quadrillion in size. Of that number close to 60% are SWAPS. SWAPS are private market, unregulated, blind, contracts that settle in CASH. Given that the base money supply M2 is a fraction of the derivative market, never mind the cash requirements of everything else, and you can see it doesn't take much for a credit crunch to morph into a liquidity event.

View attachment 142287

Currently the commercial banks are seeking to earn a pittance on overnight loans to the Fed. That is now $2T/night. Banks are holding or hoarding cash. Why? Because as the Fed shrinks its Balance Sheet, cash will become the only thing that protects them from a liquidity event...and the Fed steps back in. Or not, think LEH.

Another way of looking at liquidity is demand for the dollar:

View attachment 142288

This bear for stocks only changes when the Fed capitulates and adds back (huge) liquidity. The issue then becomes a dollar survival issue.

The point being: to call big stock market conditions (bull/bear) requires looking not only at the stock market. Currencies, interest rates (credit spreads) commodities (inflation) and bond markets are all necessary inputs.

Then look at the major segments of the market. Financials are a good one. You can never have a bull market unless the financials come to the party. Also, conversely, when the financials (banks etc) are weak, the market is weak.

View attachment 142289

The writing was on the wall at the start of the year. This next chart echoes what @peter2 and @Skate have been saying about relative strength, just on a macro level:

View attachment 142290

You can also look at discretionary v staples.


Currently we have another bear market rally. It will fail by the end of next week.

Why?

Because the Fed is still hawkish in their rhetoric. Until that changes, markets remain in bear mode as the Fed reduces liquidity. When they trigger the liquidity event and markets shed another 40%+, they will (late again) try to salvage the crisis. They are a 1 trick pony. Flood the markets with liquidity. That has been their only policy response since Greenspan in 1987.

jog on
duc
You're talking another GFC.
From the RBA:

"... The initial post-crisis focus of the G20, the Financial Stability Board (FSB) and global standard-setting bodies (SSBs)[2] was on four core reform areas: building resilient financial institutions, mitigating the ‘too big to fail’ problem, and addressing risks in both over-the-counter (OTC) derivatives markets and the shadow banking sector. Substantial reforms were developed in each of these areas, with timelines set for implementation. There were also many reforms beyond these core areas, such as macroprudential frameworks and tools, credit rating agencies and accounting standards. ... "

 
Mr @Skate, I assume that Platinum has no Buy/Sell this week...or did I miss the post?
Now about heresy:
I start a post in my thread and will send a link when ready
 
The "Platinum Strategy" incorporates an "Index Buy Filter"
When the Index Filter is off it prohibits new signals from being generated keeping you out of the markets when trading conditions are unfavorable. As the "Index Filter" is still off, there are no signals generated this week.

Sorry @qldfrog for the confusion.

I try not to make comments when posting the weekly results but made this comment on the post that has been missed.

Mr @Skate, I assume that Platinum has no Buy/Sell this week...or did I miss the post?

Correct, the Platinum Strategy has no "buy or Sell" signals this week.

Skate.
 

The issue as I see it
When trading is not going our way we tend to look for solutions when really they are not required or there really aren't any. At times for a variety of reasons, the market shift on fear & catches the best laid mathematical formulas wanting.

System Trading works some of the time
It's a simple process, as we are constantly on the lookout for breakouts of repeatable (mathematical) patterns. Then when the ride fails or the momentum slows we try to jump off before the rush. Sometimes it works, sometimes times it doesn't, but that's trading. I'm not immune to losses but over the long run, the market has been very kind to me. I'll keep doing what I have been doing. (Trading multiple strategies helps smooth out my equity curve).

Skate.
The other way to see this is that losses trigger you to act.
If trends are shorter in a permabear market with market mini bull in an overall bear fall, it is obvious strategies designed during a 20 y permabull will fail.
If this perma bull is over due to demographics and geopolitics, we have to think outside the box.
I have no crystal ball, maybe our debt based western economie and the Reset will work and keep us moving forward for decades keeping the west ahead. But i have no clues and definitively no certitude.
A short feed back loop based system should/could be the holy grail
I wrote 20y, probably more 40y with a 1980ish start
 
The first step is to find the strongest sector in the index, then find the strongest sub-sector within the strongest sector. The final step is to find the strongest stock or stocks to invest in within this sub-sector.

@DaveTrade I have selected a passage from your last post in the "the-trading-world-according-to-dave" thread, which was a great read by the way. I just wanted to clarify the reason why I made a post about using a "Relative Strength Line" as a buy condition as an alternative to using a traditional "Index Filter".

Index Filter versus a "Relative Strength Line"
A traditional "Index Filter" is a simple measure of an index. If an index is below or above a Simple Moving Average (SMA) the index is either on or off. The disadvantage of using an "Index Filter" it keeps you out of the markets when obviously there are some positions making new highs. The advantage of a traditional "Index Filter" it keeps you from trading in unfavorable market conditions.

An alternative that keeps you in the markets
Using a "Relative Strength Line" rather than an "Index Filter" allows you to keep trading whilst a "Traditional Index Filter" places you on the sideline. Professional traders keep trading no matter what the market or an index of the market is doing.

I was throwing it out there
My suggestion of exploring the possibilities of using a "Relative Strength Line" that compares a stock's price performance versus the index was one such idea. Basically in a nutshell the "Relative Strength Line" (RSL) represents new highs within a consolidation period.

The maths are simple
The "Relative Strength Line" (RSL) is a simple mathematical formula to create a "line in the sand" as part of a buy condition. It's a simple relationship to an index. This "line" is derived by dividing the stock price by the Index value. An upward sloping line means that the stock's price is outperforming the Index.

Using a "Relative Strength Line" has an advantage (at times)
In summary, when the "Relative Strength Line" makes a new high within a consolidation period, shows unusual strength in a stock that can lead to a powerful breakout. Therefore trading those breakouts can be beneficial! (sometimes)

Skate.
 
The "Relative Strength Line" (RSL) is a simple mathematical formula to create a "line in the sand" as part of a buy condition. It's a simple relationship to an index.

Would you have to use an Equally Weighted Index as base line? Because in a Capital Weighted Index, the bigger stocks that pushes and pulls the Index would a have smaller “Relative Strength” compared to that of a smaller stock (a bias perhaps, maybe).
 
Would you have to use an Equally Weighted Index as base line? Because in a Capital Weighted Index, the bigger stocks that pushes and pulls the Index would a have smaller “Relative Strength” compared to that of a smaller stock (a bias perhaps, maybe).
Even as an index binary filter, this is a worthwhile though indeed or even a small cap index if your system is biased that way..
 
Would you have to use an Equally Weighted Index as base line? Because in a Capital Weighted Index, the bigger stocks that pushes and pulls the Index would a have smaller “Relative Strength” compared to that of a smaller stock (a bias perhaps, maybe).
This is why I hate using the All Ord's as a broad index filter--it really is just a proxy for the ASX20. A weighted index would be very interesting
 
This is why I hate using the All Ord's as a broad index filter--it really is just a proxy for the ASX20. A weighted index would be very interesting

Let's review the facts
You are only using a method to give you a clue about what the market is doing to decide if you should establish new positions. Using a moving average or a variety of moving averages can be used in combination with shorter & longer time frames to hone the entry. The index you elect to use doesn't really matter in the scheme of things.

So what's the best one?
Basically, indicators based on MAs are at best an after-the-event, broad brush, very imperfect indicator. For this very reason, I've mentioned a few alternatives that vary to some degree. Unfortunately what method you decide to use "it's really only a heads-up" about what the market is doing. There are some traders who spend an inordinate amount of time looking for the best "smoothing" filter/indicator should pause for a while as there is no one method that stands head & shoulders above the rest.

Market Timing
In an imperfect trading world, the best indicator/filter is the one you design yourself, where you choose the parameters that you like to identify when to buy a position. Using & persisting with the same indicator/filter "that you feel comfortable with" over time will pay dividends.

Skate.
 
The index you elect to use doesn't really matter in the scheme of things.
Not so sure I agree with that.

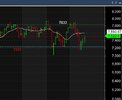
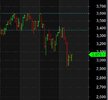
Just as an example: XAO shown in the first pic below has been range bound and bouncing between 7200 and 7800 for around 12 months and is just tracking sideways. On the other hand let's look at the other end of town and look at the smaller cap companies by looking at the performance of XSO, which is shown in the second pic. XSO tells a very different story to XAO--XSO has been is a serious downtrend for some time and is down around 15% from it's recent highs. XSO continues to retreat from its recent highs but XAO continues to have a go at breaking through its recent highs. If you were trading stocks that make up the XSO then using XAO as the basis of a market filter would be a mistake.

XAO.JPG

xso.JPG
 
The index you elect to use doesn't really matter in the scheme of things.
Good to know,
because I just created my own Index, I call it the “MAD 10 Index”. I might expand it to the Mad 200 later (maybe, maybe-not (am bored, but, not that bored)).

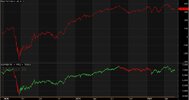
The “MAD 10 Index” is calculated by summing the days % change for the top 10 stocks listed on the ASX, then adding the current days sum to the previous days sum (it's a cumulative thingy). It's an Equal Weighted Index being unit less and all that jazz. Below is a screen shot.

MAD Shoot Bingo.jpg
(Just did it because I'm bored. I promise i won't dump anymore stuff here. Apologies for the mess.)
 
I promise i won't dump anymore stuff here. Apologies for the mess.

@SyBoo a variety of opinions are welcome. The "Dump it here" thread is about the exchange of ideas & certainly "not a contest of ideas". Also in this thread, there is no "right or wrong" when views are expressed. Every member has the right to express their views without being challenged or ridiculed.

I should clarify
When I said, "The index you elect to use doesn't really matter in the scheme of things" I was referring to that you should compare "apples to apples" & not "apples to oranges". I should have said, whatever market or index you are trading "use that market or index" to give you a clue about what the market is doing.

I suggested an alternative
Using a "Relative Strength Line" rather than an "Index Filter" allows you to keep trading whilst a "Traditional Index Filter" places you on the sideline at times. Using a "Relative Strength Line" that compares a stock's price performance versus the "index being traded" was one such idea. Basically in a nutshell the "Relative Strength Line" (RSL) represents new highs within a consolidation period in relation to the index.

Skate.
 
I should have said, whatever market or index you are trading "use that market or index" to give you a clue about what the market is doing.

I get it if your stock is part of the XJO clan use the XJO thingy. I do like the XJO thingy, it has fudge factors in it, I like fudge.
(I did have my fingers crossed when I made my above promise.)
 
Top