Australian (ASX) Stock Market Forum

Dump it Here

I mean that it would seem that your index filter is really doing the 'trading'. If trades are normally held for that long without a filer it is really mainly just the filter doing the trading it would seem.

No, the index filter is not really doing the trading. Does the filter being on or off influence the system, of course it does and as you can see it has a reasonable influence but it doesn’t directly trade specific positions as you seem to be suggesting. My filter and the way my system uses it is a little smarter than just a binary “is the market trending up or down” for turning on or off the system for the purposes of entering or exiting positions. The system is using several characteristics of the filter (not just simply whether it is on or off) to adjust near term entry and exit conditions. Putting it crudely, my filter is used more so to adjust the system (including entry and exit conditions) but it does not trade positions as you’ve suggested.
 
Last edited:
You understand that this is very debatable, I would disagree there and efficiency is based on cost, at the extreme, if it costs nothing to trade a lot, do it if the returns or risk justify it.

Then the zero sum game is actually wrong IMHO
Why? With growth of the economy/monetary inflation, the share market will always trend to grow so the buy sell exchanges making the market will always be slightly in profit by a tiny bit
The only real loser is the fact that statistically and on a long enough period, selling actions are always a mistake:
these sold shares will statistically always be worth more in the future
So the principle beyond the famous buy and forget or time in the market sayings
With a limited life expectancy, on an individual basis , it gets harder to justify as this century trend has ups and downs, and may even reverse on a society collapse.
We do not known much about the roman empire stock market trends in its decline ;-)
Nothing more enlightening than a debate with you @qldfrog ? When I say efficiency I use the term more broadly than just restricted to a cost analysis, which is very important but not the only factor. When I say efficiency I also factor in things like effort, work, risk etc. Here’s a simple example for you, you’ve got two systems and both made you 30% in the past 12 months (forget brokerage and other costs at this stage). To get to that 30% one of the systems only required you place 2 trades per month and overall you had about 25% of your capital deployed (exposure). The second system required you to place 250 trades per month and on average you had around 80% of your capital deployed. I argue that the first system is far more efficient than the second system because It generated the same return using less resources—less of my time to manage trades, less trades per month and less capital (lower exposure).

Don’t get me wrong—I’m not suggesting an efficient system is a profitable system. You referenced buy and hold, yes it’s extremely efficient but the right relatively less efficient mechanical system could beat buy and hold for profit.

I would definitely go the most profit with the least risk and effort, that said, if it could be done with buy and hold then great. It's all about weighting the factors up for the balance to suit each of us I suppose.
 
Nothing more enlightening than a debate with you @qldfrog ? When I say efficiency I use the term more broadly than just restricted to a cost analysis, which is very important but not the only factor. When I say efficiency I also factor in things like effort, work, risk etc. Here’s a simple example for you, you’ve got two systems and both made you 30% in the past 12 months (forget brokerage and other costs at this stage). To get to that 30% one of the systems only required you place 2 trades per month and overall you had about 25% of your capital deployed (exposure). The second system required you to place 250 trades per month and on average you had around 80% of your capital deployed. I argue that the first system is far more efficient than the second system because It generated the same return using less resources—less of my time to manage trades, less trades per month and less capital (lower exposure).

Don’t get me wrong—I’m not suggesting an efficient system is a profitable system. You referenced buy and hold, yes it’s extremely efficient but the right relatively less efficient mechanical system could beat buy and hold for profit.
Yes fully agree, there is a reason i did not restart all my daily systems..lower risk slightly better than weekly but easily 5xmore work and a lot of constraint..so i am with you there.
I was seeing your point initially more against the ultra fast trading: fully computerized and doing zillions of trades.
I tend to have a very high number of trades
if a system is working, i should have as much of my money working ..so very dynamic, many trades , high volatility..and great potential but obviously high risk of higher losses on mistakes or just market jitters..
My heart is still young and i did not get Pfizer ?
 
So the US has a few solid days and some "experts" start claiming the market has found the bottom and now things are on the up :roflmao: :roflmao: :roflmao: Being the pessimist I am not sure I share their enthusiasm. Weekly DJI not that exciting for me--we've seen this before and the market lacked conviction.


dji.JPG
 
So the US has a few solid days and some "experts" start claiming the market has found the bottom--we've seen this before and the market lacked conviction.

While I remain positive about the market, thoughts of a further drop of say 10% into a bear market and a sea of pain have been growing as international economic conditions continue to erode.

Summary
Caution is advised.

Skate.
 
Summary
Caution is advised.

Skate.
I find it somewhat crazy that this week's rebound in the US has been lead by a growing certainty and increasing prospects the US economy is slowing and heading to recession and this is underpinning a confidence that the US Fed will not be as aggressive on interest rate hikes o_O I appreciate I have an old school view of the world, but my view of the world is a growing strong economy would spur a rebound in the market, but no...these days an economy on the decline is all the rage. Markets never cease to surprise, hey.
 
I find it somewhat crazy that this week's rebound in the US has been lead by a growing certainty and increasing prospects the US economy is slowing and heading to recession and this is underpinning a confidence that the US Fed will not be as aggressive on interest rate hikes o_O I appreciate I have an old school view of the world, but my view of the world is a growing strong economy would spur a rebound in the market, but no...these days an economy on the decline is all the rage. Markets never cease to surprise, hey.
The Fed appearing more flexible, Demand, Employment and Wages hanging in there and BTD sentiment prevailing imo.

Just Inflation as opposed to stagflation
 
I have wondered if the results would be better with a market filter. (p2-asx-swing-trading-pull-backs thread)

Trading a pure Pullback Strategy
At times trading pullback can be hamstrung by an "index buy filter" & can lessen its effectiveness. Trading a "Pullback Strategy" constrained by an "Index Buy Filter" admittedly gives confidence but (IMHO) it's safe to trade a "Pullback Strategy" no matter how the overall market is traveling.

Trading a Trend Trading Strategy & how does an Index Filter operate?
An index filter is your safety net as it will keep you from trading when conditions are unfavourable. It can be as simple as you want it to be. A well-defined filter can lock in profits or stop you from losing more money if your position is underwater. In essence, when an index filter turns off it has the ability to protect your precious capital. When an index filter turns off you have a multitude of choices on what to do next with open positions & it's not limited by the next two examples. Example (a) you can exit all positions or (b) shorten up the "stop-loss" settings "generating" a sell signal sooner than when the index filter is on.

Skate.
 
Last edited:
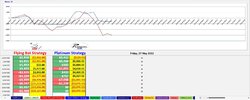
The shootout between the "Flying Bat Strategy" & "Platinum Strategy"
Over a short 6-month period should determine whether to trade with or without an "index buy filter".

(a) The "Platinum Strategy" has an "index buy filter" that keeps you out of the markets when trading conditions are unfavorable.
(b) The "Flying Bat Strategy" has "no index buy filter" & constantly trades the signals as they are generated.

The real question
Should you trade when the market is non-responsive?

The answer
At this stage "not" using an "Index Buy Filter" during these turbulent trading conditions has been "detrimental to my wealth".

Skate.
 
Trading a Trend Trading Strategy & how does an Index Filter operate?
An index filter is your safety net as it will keep you from trading when conditions are unfavourable. It can be as simple as you want it to be. A well-defined filter can lock in profits or stop you from losing more money if your position is underwater. In essence, when an index filter turns off it has the ability to protect your precious capital. When an index filter turns off you have a multitude of choices on what to do next with open positions & it's not limited by the next two examples. Example (a) you can exit all positions or (b) shorten up the "stop-loss" settings "generating" a sell signal sooner than when the index filter is on.

Skate.
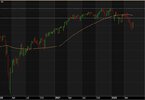
The traditional index filters based on MA of closes work well when the market is in clear up or down trend, but are absolutely terrible when markets move sideways. Last twelve months for XAO has really highlighted weakness for this style of filter--getting whipsawed all over the joint. I wonder whether a more conservative breakout trader would be better off waiting for XAO to show a strong move above 7833 even if the index has closed above the MA at levels below 7833? XAO has had 4 prior attempts to breakthrough 7833 and failed every time. Interesting times ahead, that's for sure.

XAO.JPG
 
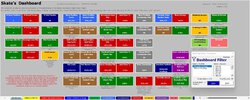
1. Platinum Header.jpg


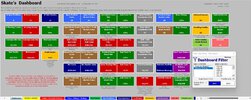
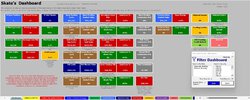
2. Platinum Dashboard.jpg


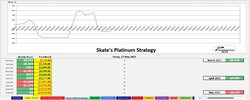
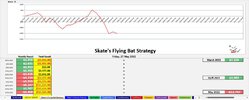
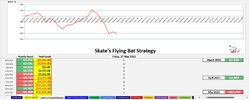
3. Platinum Equity Curve.jpg


The "Platinum Strategy" incorporates an "Index Buy Filter"
When the Index Filter is off it prohibits new signals from being generated keeping you out of the markets when trading conditions are unfavorable. As the "Index Filter" is still off, there are no signals generated this week.


5aaa. Mondays Next update Friday.jpg

Skate.
 
The traditional index filters based on MA of closes work well when the market is in clear up or down trend, but are absolutely terrible when markets move sideways. Interesting times ahead, that's for sure.

Is there something better than an Index Filter?
An "Index Filter" is normally an SMA of a nPeriod of an Index. Looking outside the box you can elect to use the performance of the share price relative to the index to decide whether a position is taken or not bypassing an "Index Filter" as described by @MovingAverage. Using the Relative Strength of individual positions eliminates this concern raised. When a traditional "Index Filter" is used it discounts positions that are "jumping out of their skin" busting higher.

Maybe an (RSL) might be an alternative
The "Relative Strength Line" (RSL) is described here: https://forum.amibroker.com/t/ibd-relative-strength-line-within-or-not-within-a-consolidation/30863 might be beneficial to "some degree" for those who have Amibroker. Basically the (RSL) represents new highs within a consolidation period.

Simply a stock's "Relative Strength Line" compares a stock's price performance versus the index
Many charting services plot an RS Line along with the stock's price, moving averages, etc. The line is derived by dividing the stock price by the Index value. An upward sloping line means that the stock's price is outperforming the Index.

Using "IBD's Relative Strength Line" has an advantage
One of the key uses of IBD's Relative Strength Line is when it makes a new high (three months, typically) within a consolidation, which shows unusual strength in a stock that can lead to a powerful breakout. Therefore it's a good idea to look out for them!

Skate.
Not that my live trading uses it now, but a few years back I was using the gradient of the MA slope as an indicator of the index trend instead of whether the day's close was above or below the MA. Found the MA slope gradient worked well and provided better performance when the market was sideways. I should dig out that code and run a few sims to post here.
 
Not that my live trading uses it now, but a few years back I was using the gradient of the MA slope as an indicator of the index trend instead of whether the day's close was above or below the MA. I should dig out that code and run a few sims to post here.

@MovingAverage let me beat you to the punch
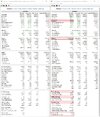
So there is no "cherry-picking" I've used a backtest comparison for this financial year (1/7/2021 to the end of trade today) My apologies to @qldfrog for the strategy name (it's the name of an old musical band).

Important metrics
I have highlighted a few metrics in red for comparison. I should also say "The Platinum Strategy" is not a slouch by any means, even though the performance of the last 22 weeks has been lackluster.

t.jpg

Also
The (Net Profit %) as well as the (P&L for closed trades) should not be discounted in those metrics. The use of an (RSL) is food for thought rather than using a "Traditional Index Filter". Without @peter2 realising his way of selecting "pullbacks" incorporates the idea of selecting positions within a consolidation period. Whereas the (RSL) selects positions that are making new highs within a consolidation period.

Skate.
 
Last edited:
@MovingAverage let me beat you to the punch
So there is no "cherry-picking" I've used a backtest comparison for this financial year (1/7/2021 to the end of trade today) My apologies to @qldfrog for the strategy name (it's the name of an old musical band).

Important metrics
I have highlighted a few metrics in red for comparison. I should also say "The Platinum Strategy" is not a slouch by any means, even though the performance of the last 22 weeks has been lackluster.

View attachment 142251

Also
The (Net Profit %) as well as the (P&L for closed trades) should not be discounted in those metrics.

Skate.
Well those frogs on toast are very intriguing--during this period the XAO has been completely directionless yet your sims show a very impressive 44% net profit, almost too good to be true. I've only quickly looked at your sim result but you've got very short hold time of about 4 bars. So many questions--what universe of stocks are you trading? Have you done any proper MC analysis on that system as I'd love to see the spread. With a 51% win rate I'm curious about the net profit because the avg win is about $1750 but the avg loss is $1190, but mind you the system has done a lot of trades at about 322. To be honest I was expecting to see a bigger spread between the avg win and avg loss for that net profit. Need to get my head around these numbers a bit more, but in the mean time care to share and details of your frogs on toast?
 
Well those frogs on toast are very intriguing--during this period the XAO has been completely directionless yet your sims show a very impressive 44% net profit, almost too good to be true. I've only quickly looked at your sim result but you've got very short hold time of about 4 bars. So many questions--what universe of stocks are you trading? Have you done any proper MC analysis on that system as I'd love to see the spread. With a 51% win rate I'm curious about the net profit because the avg win is about $1750 but the avg loss is $1190, but mind you the system has done a lot of trades at about 322. To be honest I was expecting to see a bigger spread between the avg win and avg loss for that net profit. Need to get my head around these numbers a bit more, but in the mean time care to share and details of your frogs on toast?
correction--notice your system only did 138 trades...hmmmm
 
Top