Australian (ASX) Stock Market Forum

Dump it Here

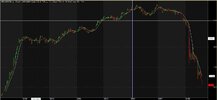
Yeah but look at the trend before that, it had already dropped about 60 to 70%. Rarely does something go from a strong trend to complete capitulation, but like I said anything can happen and no doubt it would have before.

That is just a good example of why you ride stocks up and not down
Really, so ZIP is an outlier is it? I've got plenty of more examples if you need them--just let me know?

zip.JPG
 
Really, so ZIP is an outlier is it? I've got plenty of more examples if you need them--just let me know?

View attachment 142511

I think you are missing the point, obviously stocks can go up and then they come down. But the whole point of trend following is that once the trend finishes you get out. So in my example if TER reversed I would get out, obviously I'm not going to get the top but it don't need to make a profit. But you are unlikely to lose on a trade that you are up over 200% in, that was my point. Unless it crashes 70% in a day or something like that.

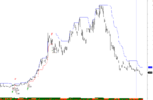
Similar to the chart A2M below, did this trade catch the absolute bottom to peak, no, but that is not the point. Once the trend reverses I don't even look at the chart. (This is a hypothetical trade I did not trade it)
1654248777455.png
 
I think you are missing the point, obviously stocks can go up and then they come down. But the whole point of trend following is that once the trend finishes you get out. So in my example if TER reversed I would get out, obviously I'm not going to get the top but it don't need to make a profit. But you are unlikely to lose on a trade that you are up over 200% in, that was my point. Unless it crashes 70% in a day or something like that.

Similar to the chart A2M below, did this trade catch the absolute bottom to peak, no, but that is not the point. Once the trend reverses I don't even look at the chart. (This is a hypothetical trade I did not trade it)
View attachment 142512

Your own words were "rarely does something go from a strong trend to complete capitulation". I was simply highlighting that the market doesn't behave that way--plenty of stocks go from strong up trends to complete capitulation--happens a lot.
 
You're own words were "rarely does something go from a strong trend to complete capitulation". I was simply highlighting that the market doesn't behave that way--plenty of stocks go from strong up trends to complete capitulation--happens a lot.
I think there has been some misinterpretation of "strong trend to complete capitulation". All good.

Moral of the story is i f***ed up not buying TER
:p
 
Skate, in case you didn't check - MYD and IFM both have takeover offers pending

@investtrader thanks for the heads up. To tell you the honest truth, I didn't even check. All my efforts are currently been directed elsewhere, which is no excuse. I called an end to the Monthly Strategy last week & as the "Platinum Strategy" has currently no positions & the "Flying Bat Strategy" has only a few it's a good time to pull the pin on these strategies as well.

Skate.
 
Last edited:
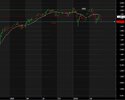
And here we are again folks...XAO back at that critical support level of circa 7233.

I get the feeling that this time it may not hold...hope I'm wrong. Interesting week ahead of us.

XAO.JPG
 
I get the feeling that this time it may not hold...hope I'm wrong

The open positions in this portfolio continued to lose value as the market fell further.

Risk Management When Trading
Panic in the market creates the risk in trading. The real issue or question that we all should be asking is "how can I control my risk so the market doesn’t knock me out". Once you are on the canvass the game is just about over. Being defensive is how we protect ourselves from the knockout punch.

It's been awhile
Most of my comments are a repeat of what I've previously posted. But a refresher on how to construct a trading plan never goes astray. At the end of a series of posts, I'll supply a basic line of Amibroker code so you to run an independent backtest.

Skate.
 
A short 6-minute video
To start. I'll attach a hyperlink to a short 6-minute youtube video that explains three categories of risks & how to minimise each of them. The video is not comprehensive but it summarises three categories giving you a grounding on why a "trading plan" is vital to trading successfully.

Risks highlighted
1. Catastophic-specific risk is where the stock completely collapses after entry.
2. There is also the normal risk (if there is such a thing as normal) where a position turns against you, resulting in a loser.
3. Then there is the market/index risk where the market goes into free fall dragging everything in your portfolio down with it.

It's worth a look


Skate.
 
We all need a trading plan
But finding a trading method that actually works is not as simple as it sounds. Being methodical & consistent is the road to success in this game. I like to "bang on about system trading" as it reduces the amount of time your trading takes each day or week. With system trading, it even allows you to hard-coded rules that go in some way in making up your trading plan. But the real issue that faces us all is "determining" whether your trading rules are profitable.

All trading is trend following
A trend-following system is a relatively straightforward approach to system trading that can be readily developed & managed with little effort. Finding an "entry condition" isn't that hard as "getting in" has never been a problem. Getting out isn't an issue either, but getting out at the "correct time" is.

Rules-based exits
In trend-following systems, the exit rule is based on some measure of whether the trend has ended. There are many ways to measure when you believe the trend has ended or the risk of remaining in the trend is no longer warranted. I must say, there are a lot of moving parts when it comes to trading that has no rules. With no rules, you can make them suit yourself.

Skate.
 
Trend Following System Trading
Combining my two favourite talking points (1) Trend Following & (2) System Trading (IMHO) forms a path to financial freedom if you can pull it off. Trend trading can have as few as five components based on your own objectives that I will touch on in the next post

Unfortunately, this is important
It's a pity but it's a fact of trading. Everything about system development is always a tradeoff & there are no absolute ‘right answers’ to achieve a perfect system. What works once might not work again, so you always have to stay on top of your game. System development can have as few or as many moving parts to give you the confidence to trade it. The exit can contain just as many moving parts as the buy condition & in some cases, more.

Skate.
 
Parameters Filters & Triggers
Let's start with the entry trigger or buy condition. Timing your entry is important that needs to be rulers based. When it comes to exiting a position "that's" when it becomes tricky. Exit too early or too late & you can kiss any potential profits good by. Every strategy must have an exit condition or conditions. A simple exit should have an initial stop at least as the bare minimum.

System design
Every system must have an entry condition, an exits condition & money management (position size) to help you achieve your objectives. Let's list five components that should be the minimum in designing a trading system.

1. An entry condition that triggers a "buy signal"
2. An Initial Stop Loss that can be wide or narrow to determine the amount you risked on each trade.
3. Have a defined "exit rule" a "Stale stop" when momentum slows & especially a "GTFO" filter when it all goes horribly wrong.
4. Money Management has to be major consideration right off the bat.
5. Position Size Rules to manage the portfolio of trades generated by your trading system.

Skate.
 
For those who have Amibroker
The entry condition (one line of code) will be disclosed so others can evaluate the simple entry condition. The buy condition (the code) is nothing special by itself & I don't use it in any of my systems. The code "Buy condition" is used for the exercise that's all. As I remarked in many previous posts, getting into a trend is not that difficult. I'll supply the line of code with two backtests to demonstrate how the entry condition can affect the outcome of a system when wrapped in different "buy filters".

How do we use or incorporate a buy condition?
The entry trigger will be the constant between the two systems. Wrapping the entry trigger in a series of "buy conditions" can completely change the backtest results.

Backest results
1. The first backtest will have a stock standard "Index Filter" (buy filter) to keep you out of the market when the Index falls below its simple moving average of a nPeriod.
2. The second Backtest will also have a buy condition that incorporates a "Relative Strength Line" in relation to the "Index" being traded.

Skate.
 
The buy condition used in the backtests
Buy = EMA( C, 20 ) == HHV( EMA( C, 20 ), 200 ); //plus a series of other filters & parameters not disclosed.

Index Filter versus a "Relative Strength Line"
A traditional "Index Filter" is a simple measure of an index. If an index is below or above a Simple Moving Average (SMA) the index is either on or off. The disadvantage of using an "Index Filter" it keeps you out of the markets when obviously there are some positions making new highs. The advantage of a traditional "Index Filter" it keeps you from trading in unfavorable market conditions.

An alternative that keeps you in the markets
Using a "Relative Strength Line" rather than an "Index Filter" allows you to keep trading whilst a "Traditional Index Filter" places you on the sideline resulting in more trades over the same period. Professional traders keep trading no matter what the market or an index of the market is doing, it's only our type of trading that uses these as a matter of course.

Skate.
 
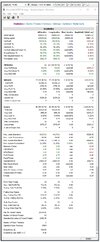
20 EMA Strategy using an Index Filter
A traditional "Index Filter" is a simple measure of an index. If an index is below or above a Simple Moving Average (SMA) the index is either on or off.

Backtest period 365 days
Why 365 days? So there is no cherry-picking the backtest results. I've supplied the entry condition (Buy = EMA( C, 20 ) == HHV( EMA( C, 20 ), 200 ); that also has a series of other filters & parameters that have not been disclosed so others can do their own backtests.

20 EMA INDF.jpg

Skate.
 
Using the same "20 EMA Strategy" incorporating a "Relative Strength Line" as the Filter
Using a "Relative Strength Line" has an advantage (at times). In summary, when the "Relative Strength Line" makes a new high within a consolidation period, shows unusual strength in a stock that can lead to a powerful breakout. Therefore trading those breakouts can be beneficial at times.

Backtest period 365 days
Why 365 days? So there is no cherry-picking the backtest results.

20 EMA RSL.jpg

Skate.
 
Top