
- Joined
- 28 December 2013
- Posts
- 6,401
- Reactions
- 24,351
@Skate and others, the insight you provide makes my brain juices flow. The research doors are wide open. Particularly the last few posts. Thank you
Uurgh, they are just like bloody party streamers all over my charts. I tried them out for about a minute when Colin added them to the indicators list until the untidiness and unnecessary junk got in my way.
Guppy's Multiple Moving Averages
As trend trading strategies go, using "Guppy's Multiple Moving Averages" would be a suitable choice as it's easy to follow & understand. The relationship between the 12 exponential moving average (EMA) tells the story of long & short-term buyers.


Guppy relies on an average of ema on different period( raw summary) so obviously can lag a bit due to the longuer period of some of these ema.Guppy's Multiple Moving Averages (GMMA)
The multiple lines of the Guppy help traders see the strength or weakness in a trend better than if only using one (or two) EMAs. The 12 EMAs are separated into two groups. Compression to the expansion of the “lines of the ribbon” tells one story whereas the reverse (expansion to compressions) tells another. On the other hand, the "crossing" of the ribbons, is a whole other story in itself. The GMMA ribbon (the indicator) identifies the trend, the strength of the trend & the reversal of the trend.
GMMA Ribbon Colours
The short-term investors are represented by the “Blue Ribbon” & the longer-term investors are represented by the “Red Ribbon”. To keep the post short, those interested can do their own research as to how these lines (of the ribbon) interact. We can use the association of the "GMMA ribbon" (the lines) to our advantage. The downside to (GMMA) it’s a "lagging indicator" that will never catch the low of the pivot but at times goes very close.
Twisting the GMMA
I’ve twisted Guppy’s idea. I've taken the average of Guppy's slow & fast-moving (EMA's) then added a smoothing factor. Using the average of the EMA bands (IMHO) sharpens the usefulness of the indicator allowing me to turn the GMMA indicator into a complete trend trading strategy.
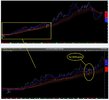
Weekly (FMG) Chart
View attachment 135170
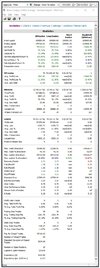
Guppy's MMA - 2 year backtest
This backtest includes the COVID period to demonstrate how this strategy handled this trading period. Overall it was mighty disappointing but overall it recovered nicely.
View attachment 135174
View attachment 135175
Guppy's MMA
Don't forget I’ve twisted Guppy’s idea. I've taken the average of Guppy's slow & fast-moving (EMA's) then added a smoothing factor. This in itself is worthy of the exercise. Twisting it up, I've used the average of the EMA bands to sharpen the usefulness of the indicator allowing me to turn the GMMA indicator into a complete trend trading strategy. It's not a perfect trend trading strategy but it's simple to follow & implement. In my opinion, don't discard Guppy's idea too quickly as a trend following system or indicator. (more lines are better than one)
Summary
The 'Dump it here' thread is about ideas, ideas that I've found helpful in my trading experience.
Skate.
Guppy relies on an average of ema on different period( raw summary) so obviously can lag a bit due to the longuer period of some of these ema.
Without revealing trade secret, you can obviously tweak this to weight various periods differently and so bring back some responsiveness..
Hope it helps:
i trade a guppy based system.
Time will tell

Indeed and as systematic trader, i just adopt a set of weight /period parameters which statistically work for my system on a given period, very different from the visual chartist in you Ann.Obviously, a person can create whatever group of MAs in any time frame they wish. One could always experiment with different times of MAs both simple, weighted, or exponential. Guppy has the short-term MAs typically set at 3, 5, 8, 10, 12, and 15 periods. The longer-term MAs are typically set at 30, 35, 40, 45, 50, and 60 according to Investopedia.
Ignoring the bottom two MAs of 50 and 200 on the chart which are mine, you can play with the MAs by switching on and off MAs in the tick box. I tried that back in the day but I still found it obliterated the chart information for me and I just missed so much, as by then it had been a few years and I had learned to chart without gimmicks. But it could work as a basis for creating a personalized group if so desired.
View attachment 135188
Guppy's Multiple Moving Averages (GMMA)
The multiple lines of the Guppy help traders see the strength or weakness in a trend better than if only using one (or two) EMAs.

May I be a Dopey Dora and get you to rephrase these two sentences, I truly have no idea what you are saying. Dyslexia, sorry.Indeed and as systematic trader, i just adopt a set of weight /period parameters which statistically work for my system on a given period, very different from the visual chartist in you Ann.
My approach will always be sub optimal at a specific time.but i think peope now understand and fit to their needs/approaches
Over the past few months the media has certainly been ramping up the prospects on an imminent interest rate rise and of course the media being the purveyors of doom and gloom that they are like to claim the share market will be headed to Armageddon once we get an interest rate hike. So today's article in the AFR (headline below) got me thinking--how exactly has the market reacted to RBA cash rate increases. Unsurprisingly the facts are very different to the media's perspective.
View attachment 135183
So let's take a look back at the RBA's official cash rate going back to 1990--cash rate is shown below.
View attachment 135186
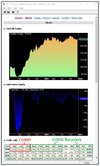
Now let's look at the XAO for the same period (today back to around 1990)
View attachment 135187
A few key observations:
a) During the period from around 1990 to 1993 the RBA cash rate experienced a dramatic decline of over 50% yet during this rapid decline in the cash rate the XAO seemed to have a period of just moving sideways. Certainly there was no remarkable movement in the XAO that you might otherwise expect to be the result of a significant decline in the cost of money.
b) We saw amazing growth in the XAO from around 2003 to 2007, but guess what? During this period RBA cash was also increasing and in fact it rose about 50% over this period.
c) We then had the GFC kick in in 2008 and while the XAO experience a significant decline so to did the RBA's cash rate.
d) Finally, during the period from 1994 to 2002 we experience some volatility in the RBA's cash rate but despite the ups and down of the cash rate the XAO just kept on marching upward
So, despite the AFR's headline today I'm not too sure that history shows us that the market does not react well to hikes in the RBA cash rate. Sure, in the short term an increase in the RBA might scare the market a little but history would appear to suggest that the market will brush off the rate hike and continue along its merry way.


People either "get " the GMMAs or they don't. Their real advantage is indicating the strength of the trend. When the shorter term MAs move apart from the longer MAs the trend is strong. If the trend is strong don't sell the short term pull-backs.
The thing is rates do not need to get to 8%. Rates might only need to get to 2.5% to trigger a market crash, say 15%+ decline, at which point I'm betting the Fed are straight back down to ZIRP which is a real NIRP. That is a 100pt basis point move from where we are.
being a systematic trader means I need to have a one fit all approach within my realm: SP range, index belonging so it is a given that i will not have the greater optimisation that you require as a visual chartistMay I be a Dopey Dora and get you to rephrase these two sentences, I truly have no idea what you are saying. Dyslexia, sorry.


There's enough free material on the internet, in the library, on youtube, that you should never have to pay for anything.
Apologies froggie, I had no idea English was your second language. Sometimes I can pick accents within the written word but not with yourself. This is what I am hearing you say, please correct me if I have misunderstood.being a systematic trader means I need to have a one fit all approach within my realm: SP range, index belonging so it is a given that i will not have the greater optimisation that you require as a visual chartist
no dyslexia here but english as a 2nd / 3rd language so I produce a lot of garbage.but well intented..well that is my genuine purpose...
.and here i am on the computer..when on the smartphone keyboard, i am pathetic
My apologies Ann..I also tend to be too..far too verbose..the latin side in me
My approach will always be sub optimal at a specific time.but i think peope now understand and fit to their needs/approaches
your point about bold and and concise text is nice to know.Apologies froggie, I had no idea English was your second language. Sometimes I can pick accents within the written word but not with yourself. This is what I am hearing you say, please correct me if I have misunderstood.
"being a systematic trader means I need to have a one fit all approach within my realm:" = I understand this to mean- I want a simple way to trade where I don't need to think about it.
Fair enough as long as it is making you constant and sustainable profits. If not then perhaps you may need to find another simple system where you don't need to think about it or potentially not trade until you can work out a better way.
You are certainly are not pathetic, nor verbose and I have never read garbage from you. That is why I was so keen to understand what you were saying to me. I find with dyslexia, I have trouble with comprehension, I fully understand each word but in combination over a sentence or two, it can become totally meaningless. That is why I like to read @Skate, as he puts up a bold heading and then with very few words explains what he is trying to say. This is really the best way for Dyslexics to read.
I am reading this as meaning "I could do better if I had the time and energy" Fair enough! I think the most important part of all is if you are having fun. Qudos to you for putting your trading on display. I need to make more time to enjoy other peoples' trading journals.
Ann,No on the contrary Skate, I must disagree, the SMA is not a lag because it is a watched signal/indicator, a trigger for the dozens, hundreds or thousands of traders waiting for an entry indicator/signal/whistle blow/ trigger/gunshot/ whatever you want to call the point where the trader commits his money. Many people try to get very clever with MAs thinking they will get an edge. If you are using a less used MA, you will have a less-used entry/exit point. The best edge anyone can ever have is to know when the majority of traders are going to commit to a trade, that is why I use the 'simple' MA as that is the standard-setting on Stockcharts, the 50dsma and 200dsma. More traders would use Stockcharts than any other chart system around. I want to be right in the thick of the herd so I can get the go signal as it happens.
1. Interest rates per se haven't triggered market crashes--broader economic/social woes do, but not interest rates.
2. Let's look back to our recent crashes--the 2000 dot.com crash was triggered by massive overvaluations that came home to roost.
3. The 2008 crash was triggered by defaults of junk mortgage backed securities and the 2019 crash was triggered by fear of the sky falling in because of covid.
4. So I don't think there is anything to suggest that interest rates getting back to 2.5% per se will trigger a stock market crash.


Nope--not that simplistic. You omitted the fact that there was also a coinciding broad-based fall in the value of the underlying assets which made the prospect of refinancing very difficult. That coupled with the fact that people could pretty much just walk away from their liabilities resulted in the large defaults that triggered everything else.3. And why did junk bonds default? Because they were ARMs (Adjustable Rate Mortgages) that were set very low with teaser rates that then adjusted higher once the teaser period was over. The crash was the most expected crash ever.
3. And why did junk bonds default? Because they were ARMs (Adjustable Rate Mortgages) that were set very low with teaser rates that then adjusted higher once the teaser period was over. The crash was the most expected crash ever.
Nope--not that simplistic. You omitted the fact that there was also a coinciding broad-based fall in the value of the underlying assets which made the prospect of refinancing very difficult. That coupled with the fact that people could pretty much just walk away from their liabilities resulted in the large defaults that triggered everything else.
We use cookies and similar technologies for the following purposes:
Do you accept cookies and these technologies?
We use cookies and similar technologies for the following purposes:
Do you accept cookies and these technologies?