MovingAverage
Just a retail hack
- Joined
- 23 January 2010
- Posts
- 1,315
- Reactions
- 2,565
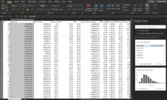
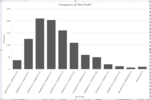
Yes, it might be helpful to have some sort of Excel template for this. In the past I've tended to just past backtest runs into Excel and do formulae to pull it together for something worth graphing. Can't find the spreadsheet where I experimenting with Stevo style output frequency histograms, but here is a fairly primitve set set of bar graphs when I was trying 10 runs with small % randomness built in to Buy while various Buy conditions where turned on or off (or optimized). This is for a single 10 run backtest. You'd need to run around 200 to get something approaching the steve plots in my post above of course.
Looking forward to future posts MA when you have time.
Agree there is value not only in increasing key parameters, but considering spread of possible values in your backtest universe - in real life you always tend to end up closer to the min value than max
View attachment 127832


Sadly true, working in IT, i have seen many like him.it is sad to show such arrogance preventing meaningful improvement in the software.which is looking a bit outdated by now and also has some bugs left after more than a decade
@Warr87 @Linus van Pelt Do you consider RealTest as being the closest competitor to AB?
I should maybe give a try,?I would think so. it's pretty versitale software IMO. it doesn't have all the bells and whistles of tones of indicators that AB has. i coded up a supertrend indicator (and marsten helped!), and if its not available you can ask marsten. he'll even help with some code to include in your script, or add it to his to-do list in the next update. i find RT to be more intuitive as well. it handles multiple strategy testing better too. even testing things like futures is much much easier in RT than AB.
What scripting language do they use? Please tell me Python ?I would think so. it's pretty versitale software IMO. it doesn't have all the bells and whistles of tones of indicators that AB has. i coded up a supertrend indicator (and marsten helped!), and if its not available you can ask marsten. he'll even help with some code to include in your script, or add it to his to-do list in the next update. i find RT to be more intuitive as well. it handles multiple strategy testing better too. even testing things like futures is much much easier in RT than AB.
I think the key "shift" that people need to make is that whereas in AB you have to define some specific arrays in advance (mainly buy and sell) and maybe declare some "applystop" rules, in RT all of the strategy element formulas are like callback functions in an event-driven model. So for each bar, it is calling your EntrySetup to find out if this stock is an entry on this date, and for each position it's calling ExitRule, ExitLimit and ExitStop to see if there's an exit condition and/or a target or stop price in play as of this bar. Your formulas for these callbacks can then access the context via all of the relevant syntax elements. You might say this is like CBT without CBT.
What scripting language do they use? Please tell me Python ?
I would think so. it's pretty versitale software IMO. it doesn't have all the bells and whistles of tones of indicators that AB has. i coded up a supertrend indicator (and marsten helped!), and if its not available you can ask marsten. he'll even help with some code to include in your script, or add it to his to-do list in the next update. i find RT to be more intuitive as well. it handles multiple strategy testing better too. even testing things like futures is much much easier in RT than AB.
Thanks. This comment also goes to AB…but I wish these guys would stick to a native language and avoid using a “like” language.Python-like, not Python.
Most of these are by an enthusiastic end user. I think the presentation to Cesar Alvarez is by Marsten.
Check out the videos. Most are short (~10 mins). You'll see the scripting language. You can decide for yourself.Thanks. This comment also goes to AB…but I wish these guys would stick to a native language and avoid using a “like” language.
Nice review, thanks. Certainly some of the issues you raise about AB are very true. BTW, there is an easy resolution to the weekly buy day showing as Monday not Friday. Have you looked at the “Intraday” tab (yes strange this is under intraday) in the Preferences settings? I’ve just downloaded the software so will be interesting to look at—I’m very keen to see what it’s backtesting and optimisation speed is like.I agree with everything @Warr87 said.
Random, stream of consciousness thoughts...
I describe the difference between RT and AB this way (it's just an analogy, it's not perfect):
AB is analogous to Python: it's big, can do a lot, requires strong programming skills, will likely take you longer to code, you can shoot yourself in the foot if you're not careful.
RT is analogous to Excel: it can't do as much as Python, requires less programming skills, you can likely code it faster, harder to shoot yourself in the foot, there are many things it does better than Python.
If all you needed was a financial spreadsheet, would you code it up in Python? You probably could, but why would you?
AB is more a programming environment, RT is more a scripting environment.
You're not going to suck in a web page, or read and write to external files (except built in functionality), create fancy charts that are beautiful eye candy (but do they make you money or just impress your friends?).
RT makes if very hard to code a future leak...you have to really try, almost do it on purpose. It's possible, just much harder than with AB.
RT makes "sense" in places that AB doesn't. One example: if you are using weekly bars, it will show your buy date as Monday, not Friday. I mean, WTF Amibroker? It's just software - can't you work out what day Monday is on a weekly bar?
In RT, you import your data from Norgate (or other providers) into a binary format. Think of it like your hiberfil.sys file when you hibernate to disk. It a memory image saved to disk. It can take a long(ish) time to do the download (like 5 mins, sometimes longer if you're importing the entire NYSE from 1990-today), but once you've done so, RT is really really fast. I actually did a walkforward in RT, something that would have taken days in AB using my laptop. But for live trading you would just import the data you need (shorter time frames). Sometimes I can run a backtest in 1-2 seconds, especially when run repeatedly - the first time caches the data formulas in memory. Think of it like static variables for the first run, then subsequent runs only update those formulas when required. In many ways it's faster than AB.
It has built in rolling backtests via optimization, so I don't need my Powershell script to do that.
You can easily combine multiple strategies in one, say a long/short hedging strategy, where the two strategies are "self contained" (hard to describe - I'd show you the samples but that probably violates the RT license, esp. if I posted it here). As Warr said, the examples are really good, not just to illustrate the many capabilities of RT but as trading systems themselves.
The documentation is clear, written by a native English speaker, and not full of typos, grammar errors, and incomplete or inconsistent examples.
One thing that is really cool is the strategy can use it's own equity curve as input. I like to describe it as being "self aware". I read in a Bandy book that you should use daily mark to market performance to make trading decisions (position size, whether to switch off, etc). With RT this is easy.
RT is written by a very successful trader, and is built for traders. AFAIK Tomasz is not a trader.
Things you have to use the CBT for you can just easily code in RT. A quote from Marsten:
RT is much "younger" than AB, so it doesn't have all of AB's bells and whistles. For now, I will still use both, esp. AB's charting capabilities to visualize price patterns that I can try to code into a system. Hopefully, when my license for AB expires (AFAIK it will still work, I just won't get updates), I will have completely transitioned to RT.
I won't miss the the toxic culture of the AB forums. The culture in the forums, like the culture in many organisations (or even recent US Presidencies) is toxic because it flows down from its leader. Its members follow the example set by its leader.
I am biting the bullet and going your way.some of my systems have plenty of buys and i can not fault the logic /process of doing a proper MC vs what MA showed was dummy MC on ABThe Importance of Monte Carlo Analysis and the Way you Do It.
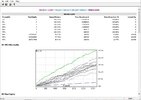
At @Cam019 recently responded to my VPN post and it spurred me into action about sharing my thoughts on the way Amibroker does Monte Carlo (MC) analysis. I'll explain to you why I believe Amibroker doesn't provide accurate insight into a system's performance using its built in MC analysis. I'm not going to explain what MC analysis is (Google is your friend for that) other than to say in simple terms that it provides a much clearer picture on the range of your system's performance (worse case through to best case) on just about any metric you care to judge your system by. I mean no offence to anyone by saying this, but anyone who moves from developing and testing a system to live trading that system based on single back-testing results without regard to MC analysis is just asking for trouble.
Amibroker and its Built In Monte Carlo Analysis
I am a massive fan of Amibroker and nothing comes closes to its capabilities for rapidly developing, testing, refining and executing trading systems. Personally. I struggle to fault Amibroker....but. Yes there is a but....and for me that is its built in MC analysis--it is terrible and to me it seems very much like a quick and dirty add on. I'd never say that to Thomaz because as those that frequent the Amibroker forum know all too well, hell have no fury like a Thomaz scorned
Anyway, what is it I don't like. Well in summary, the way Amibroker does MC is that it simply uses the executed trades (taken) during a single back-test and merely shuffles those around in time. What's the big deal about that I hear you say, well to me understanding the system performance and the extremes of how that system will perform is not provided by simply re-shuffling in time a set of executed trades. I struggle to understand what insight that actually provides in terms of broader system performance.
In my opinion the best way to understand how a system performs is to use an MC approach in which each of the runs executes a different set of trades. There may be some overlaps between the different trade sets, but what is important is that there are different trades in each distinct set. Amibroker's internal MC testing does not approach it this way so how do you achieve that? Well as I mentioned in my response to @Cam019 the best way to get there is through adding a randomness element to your buy conditions. In Amibroker this can be done using the mtRandom() function. Using a dummy parameter and optimizing that over say 1000 runs (this value needs to be considered carefully in the context of how many signals your system generates) you will end up with 1000 different backtests from your system over different trade sets. You can export those optimization results from Amibroker into Excel and do some great statistical (MC) analysis. This in my opinion is the easiest and best way to do MC analysis of your system and will provide far superior insight to your system's performance. The other big advantage of this approach is that you can do MC analysis on just about any system metric you can think of--Amibroker only does MC analysis on the equity curve and to me there are other aspects of a system I'm more interested in doing MC on other than just the equity curve.
MC analysis can be an extremely complex subject and so the above simplifies a lot of important points that you would need to consider. For example, my above comments assume your system generates far more signals than you can take. If you have a system that only generates a few signals and your system takes all of them then my suggested approach is probably not applicable.
Summary
Please tread carefully when looking at Amibroker's inbuild MC analysis. All it does is shuffle around a set of executed trades from a single back-test, which to me doesn't really provide any meaningful insight into a systems broader performance. For better MC analysis and realistic insight consider adding randomness to your buy condition and doing analysis with an external tool such as Excel.
That’s a great set of charts @Newt -- well done. That's exactly what I do. These charts provide some real insight into what you can expect out of your system and of course you can apply this technique to any of the metrics AB spits out.@MovingAverage - thanks for showing what the latest Excel can do. I'm behind the times there, but the good old Data Analysis module in older Excel versions doesn't make it too hard to knock up graphs for columns in a spreadsheet and whack on some formatting. Below are frequency histograms for 200 runs of a TF system over many years, in "Stevo format". The only element of randomness in these 200 runs was a 1/13 chance any particular set of Buy signals would NOT be taken.
Obviously this is yet another decision to make, as to how you "randomise". Have read about people introducing noise into price itself, BUY signals (or components of the overall signal).
View attachment 127840
@Newt - If you are talking generally about MC results (regardless of the tool) then absolutely you are on the money--no way I'd live trade any system that shows even 1 negative run. However, I wouldn't make that decision based solely on the MC results shown in AB for the reasons I've previously described. If MC analysis in Excel or TradeSim are showing any negative returns then no way I'd live trade it.I do worry MA if there are too many "failed/neg" runs in a MC - could be suggestive of too high a risk of ruin? (a whole new realm to explore....).
We use cookies and similar technologies for the following purposes:
Do you accept cookies and these technologies?
We use cookies and similar technologies for the following purposes:
Do you accept cookies and these technologies?
