Australian (ASX) Stock Market Forum

Dump it Here

I think that monitoring the number of signals found by these two systems could be a valuable switching mechanism that may work much better than an index filter alone.

Without giving too many secrets away
A simple measure (as a rule of thumb) is the ratio of "buy signals" versus "sell signals". It's not the number of signals but the ratio between the two. This is not how I decide to rotate out of one strategy into another but it's a "quick & dirty" explanation.

I'm glad @peter2 & I are on the same page
I posted my "method of strategy rotation" last Monday. (as a switching mechanism)

I think this idea may be a better mechanism than an index filter because the index is so market cap heavy.

In total agreement again
I've found better ways to take advantage of an Index Filter. I've found using an index filter annexed to a buy condition counterproductive for the reason that has already been stated. (The Index is driven by a few companies)

Interesting topics have a habit of drawing in comments from the more experienced
It's great to see topics (about all things trading) being discussed

Peter, thank you for making a great post
Duc & yourself (IMHO) have posted great content today & I've marked both accordingly.

Skate.
 
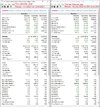
CUBE Strategy JOINED.jpg

4. Cube Signals Capture.JPG

Generating Interest
I'm posting the "Cube Strategy" signals as there may be some who would be interested in following how the "Cube Strategy" performs during the paper trading process. Updating the paper trading process of the strategy might help to keep the thread active. Other than that, the analysis signals may hold some interest for a variety of reasons.

Skate.
 
I thought Warr87 put it welll the other day - we don't always have to shoot the lights out to beat broader market or super fund returns. Peter2 large cap thread has a similar theme. Will be interested to see how both hold up long term as potentially this is another form of diversification for future capital and profits - move to more conservative slower growing and hopefully low DD strategy.

Guess that's what the Bee investment strategy is too in a way.....

It's certainly not as 'sexy' or 'exciting' as a more active system but I think it has its merits. It is a much more of a longer term kind of investment so I think it is paired well with my super.

Time will tell though.
 
All of those things can be done easily in Realtest and probably can be done in AB.

It's pretty easy to test different allocation amounts, withdrawals etc.

I think Marsten is going to start a youTube channel to show what Realtest can do.

Here's a YouTube video of a recent Amibroker Canada user group meeting.

Really great demo of RT by the developer Marsten Parker. Will consume 2 hours of your life ;). Fast forward to 10:00.

 
Here's a YouTube video of a recent Amibroker Canada user group meeting.

A graphic cut from the YouTube video posted above
Sharing trading ideas is how I strive to be a better trader. Experimenting & posting new trading ideas (well, new ideas to some) may hold some improvements & at other times none. The graphic below reinforces my trading views by

(a) striving to improve my strategies even if the current results are good &
(b) Making a habit of learning from what others have posted.

New Ideas - Capture.JPG

Why make changes to a strategy?
The answer to Marsten Parker's "rhetorical question" can be found at the (31:36 minute) mark.

Skate.
 
Last edited:
Sharing trading ideas is how I strive to be a better trader.

For those interested in Nick Radge's day trading idea
I've just finished coding the "Day Trading System" discussed in Marsten Parker's webinar posted by @Linus van Pelt. The web page with all the Amibroker parameter setting can be found here: https://www.thechartist.com.au/building-a-day-trading-system/

Nick's idea
In summary, Nick uses the ADX to measure the strength of a trend, not the direction (nothing new here). It’s commonly suggested when the ADX is above 30, the market is trending. When below 30 the market is range-bound or changing trend. Combining the ADX with a trend filter is how it’s generally used.

Moreover
Nick calculates the ADX for the last 5-days & (a) if the reading today is greater than yesterday, & (b) the reading today is greater than 5-days ago & (c) the reading today is greater than 10 days ago, it generates a signal to buy a dip tomorrow at open. Pretty simple really.

To calculate the dip
Take the Average True Range (ATR) of the last 5-days & subtract it from today’s low, this is known as the ‘stretch’. Then the signals are "ranked" using the Rate of Change (ROC) over the last 5-days. Any positions opened during the day will be exited ‘market on close’.

More to follow.

Skate.
 
To calculate the dip
Take the Average True Range (ATR) of the last 5-days & subtract it from today’s low, this is known as the ‘stretch’. Then the signals are "ranked" using the Rate of Change (ROC) over the last 5-days. Any positions opened during the day will be exited ‘market on close’.

I'm not a fan of exiting the same day
My twist on Nick's idea will be to leave the position open until I get an exit signal to close out of that position.

Twisting it up
The backtest results displayed on Nick Radge's website use the Russell-1000 Universe. The backtest results I'll post will be traded against the "All Ordinaries". The same basic setting, with a few minor filters, added.

For those interested in "Day Trading"
How Nick Radge manages his day trades can be found here: https://www.thechartist.com.au/how-i-manage-day-trading/

More to follow.

Skate.
 
1. Changing nature of markets
Having an "edge" might be an accepted "catchphrase" when trading is going gangbusters. When trading is performing badly, we readily accept that our strategy has lost its "edge" & we set about improving it.

2. How?
By fiddling with a perfectly good strategy "without" knowing what the "edge" is or what having an "edge" really means. Luck, randomness, market timing, could be all tributers to my trading performance.

3. Perseverance
One thing I do know that I possess in spades is "perseverance" - maybe that's my edge.

Skate.


1. To answer whether traders can possess an 'edge' is really analogous to asking whether markets are a random walk. To answer the latter question, you have to ask and answer the following: can traders predict the future?

Certainly 'fundamental analysis' whether macro or micro, attempts to do precisely this. Earnings and earnings growth trajectories will be calculated in any number of ways, which, is a prediction of the future. When undertaken for a stock, belief in the narrative combines with financial projections to create a trend. TSLA is currently the perfect example. In the past we had Enron etc.

The 'trend' overcomes the random walk of the future, as long as the future does not seriously break the narrative. The trend will periodically be tested by profit taking, poor earnings (as long as the excuse is believed, the trend will likely continue) and any number of potential flies-in-the-ointment.

The trend ends when something serious breaks the narrative, the financial projections or a combination of both. In other words, the prediction of the future was proven to be incorrect as the future becomes the present. A random walk is usually presented on a daily basis. My proposition is that a random walk can extend across much larger time frames, thus giving the impression of less randomness than actually exists. This same basic principle is fractal: that is to say, top down or bottom up, it works the same way.

2. So your system will (should) have an articulated edge. This should really be no more than a single sentence. It should not exceed a single sentence because much more than that and you are creating too many qualifiers, which is basically overfitting your edge to the current market conditions. Your strategy or system is a collection of rules (hopefully less rather than more) that code your edge. If you are fiddling with your system, you do not actually (or probably) do know what your edge is. @Skate has identified his edge: trend following. An edge summarised in 2 words. All that remains are the entry rules and exit rules. When the system delivers poor results, the system is not broken: it is that the market being traded is no longer a strongly trending market (unless you have chronically overfit your rules to a very specific type of trend) in which case, yes, maybe the system is broken.

3. Perseverance as an edge must be linked to capital. You can only persevere if you are liquid, which rather raises a secondary topic.


jog on
duc
 
Twisting it up
The backtest results displayed on Nick Radge's website use the Russell-1000 Universe. The backtest results I'll post will be traded against the "All Ordinaries". The same basic setting, with a few minor filters, added.

Skate's version of Nick Radge's "Day trading strategy"
To be "as fair as possible" in keeping with Nick's original ideas of using just three indicators (ADR, ATR & ROC) to measure the strength of a trend & ranking of the signals using a Rate of Change (ROC) indicator over the last 5-days - I've added a few of my tricks to the concept.

Russell-1000 Universe
I have no way of running my version of Nick's idea against the "Russell-1000" Universe so I'll be using the "All Ordinaries". Also, I've used additional filters to align it to the parameter setting that I know works with the Aussie universe of stock.

Backtest Results
This calendar year (2021) versus the last financial year (1st July 2020 to 30th June 2021). The results aren't too shabby, the basic idea is effective & I'm sure spending more time on the strategy the results could be improved.

Nick's Day trading BACKTEST Results Capture.jpg

Skate.
 
Interesting topics have a habit of drawing in comments from the more experienced

Posts with "great content"
@ducati916, I enjoy reading posts of "interest" that always motivate me to strive to be a better trader. It's a pity "knowledge & experience" takes time to gather & develop. I'm happiest when difficult topics are explained succinctly, easily understood by others. At times recalling the correct terminology sometimes escapes me. At times it can be confusing for others when I type what I'm thinking. Also, when I try to condense a post (to keep the reader interested) it can lose something in translation.

Using the ideas of others
Over time I've used the meaning of the words in posts to create indicators & trading systems. I try out every new idea to determine if there is an "edge" to improve my overall trading results. I spend all my day crunching numbers looking to ride off the "experience" of others. When @Linus van Pelt posted a 3-hr YouTube video, my initial thoughts were (WTF). I should "apologise" for thinking that.

I assumed it would be 3-hrs of my life I'll never get back
But on the contrary, it gave me the opportunity to make another few posts that I believe would have an educational value to some. There are members who are time poor so I've watched the video, coded the strategy & posted backtest results. If my posts strike a chord, I'm sure some will open the hyperlinks & take it to the next level.

Skate.
 
Backtest Results
This calendar year (2021) versus the last financial year (1st July 2020 to 30th June 2021). The results aren't too shabby, the basic idea is effective & I'm sure spending more time on the strategy the results could be improved.

Before I finalise posting about Nick's Day Trading Strategy
I should post a few comparison backtest reports. I have a few handy Daily Strategies so I'll do a shoot-off. I was wondering how Nick's idea would perform compared to a few of my trading strategies.

#1. Backtest (1st July 2020 to the end of trade today 12th April 2020)
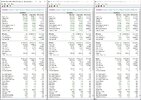
The shoot-out contenders (1) Skates' Heavy Hitter Daily Strategy, (2) Skates Daily Panda Strategy & (3) Skate's Version of Nick's Day Trading strategy. The results indicate all 3 performed well.

Comparison 2020-2021 Capture.JPG


#2. Backtest (1st January 2021 to the end of trade today 12th April 2020)
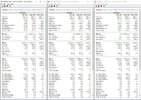
The shoot-out contenders (1) Skates' Heavy Hitter Daily Strategy, (2) Skates Daily Panda Strategy & (3) Skate's Version of Nick's Day Trading strategy. The backtest period is this calendar year.

What an eye-opener
This year has been a struggle with trading only picking up these last few weeks. The results all varied in performed but I was amazed that Nick's Day Trading Strategy handled this period as well as it did.

Disclaimer
It's been a while since trading a daily strategy. (personally, I don't enjoy the added work)

Comparison 2021 Capture.JPG


Summary
Nick's basic idea using 3 indicators to "Day Trade" has (IMO) merit.

Skate.
 
Last edited:
@Skate,
How do you physically trade 40 positions on your weekly system?
Do you sit there and enter in 40 positions, surely theres an easier way?

I know Nick Radge has a custom built API, is this something you use as well?
 
@Skate,
How do you physically trade 40 positions on your weekly system?
Do you sit there and enter in 40 positions, surely theres an easier way?

I know Nick Radge has a custom built API, is this something you use as well?

@othmana86 let me post a few comments @peter2 has made in trading a 40 position portfolio

I've been inspired by @Skate's generous contributions regarding some details of his ASX weekly hybrid system. I've been particularly intrigued by the number of open positions in his portfolios (40 - 53). That's a big number to manage and is normally too many for an active trader to manage effectively.
Another observation: I''ll always find plenty of opportunities to consider buying and I'll have a hard time selecting one or two. Now, with so many positions to fill I have been adding them all. Buy them all and cull the losers later. It's quite liberating.
The reason I'm managing a 40 pos portfolio in this thread is to monitor the portfolio heat and see if I can consistently apply an active management style to a portfolio with a large number of positions. It appears from skate's comments that there are approx 6 buy/sells each week once a portfolio is established (more getting a portfolio started). Every one of us can handle that.

Establishing a 40-position portfolio
Well, mathematically you would expect it to take twice as long to fill a 40-position portfolio as a 20-position portfolio - but that's not the case.

Why?
Because there are normally more signals than funds available when trading 15-20 position portfolios.

Once the strategy is full
Trading a larger portfolio, the workload is minimal once the portfolio has been established.

I know Nick Radge has a custom-built API, is this something you use as well?
No, I don't use an “Application Programming Interface” (API)

Why?
I have a need to be fully hands-on as I'm not a trusting person.

Trading 9 weekly strategies
The workload is not that great, it's rather boring most of the time. The Covid-19 flash crash was the only time I can remember scrambling to exit multiple positions all at once. (that's over a 6-year period) Most of my strategies have a long hold period & don't have a habit of jumping in & out of position with regularity.

Skate.
 
Using the ideas of others
Over time I've used the meaning of the words in posts to create indicators & trading systems. I try out every new idea to determine if there is an "edge" to improve my overall trading results.

Enjoy your posts as always @Skate

Given the above, and your reference to Nick Radge's ADX etc, I must confess I was surprised that you discounted in no uncertain terms, the possibilities of using the VWAP as an "indicator" a few posts back?

A moving average of the VWAP (in any time frame) relative to the moving average of the current price, (in my opinion), could potentially give a deeper insight into short term price action, and may "tighten" up the accuracy of entries/exits?

I don't trade systems, so maybe I'm missing something?

Just a random thought:geek: I have no data other than gut feel to backup my suggestion.:borg::bookworm:
Cheers.
 
Given the above, and your reference to Nick Radge's ADX etc, I must confess I was surprised that you discounted in no uncertain terms, the possibilities of using the VWAP as an "indicator" a few posts back?

@barney, I’m at a loss to “your reference” of the acronym (VWAP) - I take that to mean the “Value Weighted Average Price” a reference often made by Nick to signify “the opening price of the markets”. You may be referencing something entirely different. - so would you kindly expand on which one of my posts you are referring to.

Skate,


Your Thread is so epic, it took me a while to even find the posts :nailbiting::happy:

I mentioned the VWAP back in posts (4825 (27) ) in response to another poster (Moving Average I think)

Your post (4831) indicated you would never consider using VWAP as an "indicator"

Not actually related to Nick Radge; just that you mentioned testing his system utilizing ADX etc.etc.

Given your deep study into systems, I just thought that VWAP may have some potential in tweaking a system's entry/exit parameters?

For eg. VWAP and the moving average of VWAP relative to Price and the moving average of price

Could make for some very interesting statistics.

I can't code so I will never know, but I can certainly imagine some useful info would spring from the numbers generated.;):bookworm:

Cheers.

ps Yes ... Volume Weighted Average Price.
 
A filter which I often check on a Stock that has had ultra high intra-day Volume. Definitely not a red flag, but might be worth considering when sitting on large gains?? (pps) I wonder if some kind of back test could be done to see the historic relationship between large moves relative to VWAP and where a Stock Closes in relation to said daily moves etc etc?? Mr. @Skate? ;) :happy:

:)Yeah it won't tell you when to Buy or Sell of course, but it definitely gives perspective knowing at what level the bulk of the money changed hands over a given day (and more importantly, days) Bit hard with ONE today because of the huge one day spike. It closed at 37.5 with a VWAP of around 34.5 so at least today, that is positive price action. Hopefully Mr. Skate might have done a little research on it's usefulness :)
@barney the issues you raised, frankly, I never think about (or want to). The issue @MovingAverage raised, those of trading by emotions - I've covered many times before in this thread.

I keep my trading style simple & consistent
I get in - I get out & everything in between is out of my control. My energy is spent researching new trading ideas & sharpening the signals of the strategies that I already trade. When you get a series of trades under your belt (experience) you tend to roll with the punches rather than reacting to them.

Ok @barney, I've found your post in question & the answer I gave appears to be dismissive.

Using the VWAP as a filter
I use volume & price filters in all my strategies, turnover as well. Stock that has "ultra-high intra-day Volume" is not a measure I can use trading a weekly system. Ultra-high volume could be coded as an indicator of some value depending on the direction of the price movement.

Anyone interested in the idea Barney raised
Karthik Marar "Buying and Selling Pressure Indicator" has invoked a lot of interest & is actually a very simple indicator using the daily excursion of the price. Very simple Indicator, using the open, High, Low, Close, & volume. It obviously not a Holy Grail, but does give a very good picture of the buying & selling pressure that provides an easy visual presentation of the dominating pressure.

Hyperlinks
Read about it here: https://karthikmarar.blogspot.com/2012/09/buying-and-selling-pressure-indicator.html
Download the indicators here: https://sites.google.com/site/karthikmarar/buying-and-selling-pressure-indicator
Visual of the indicator on a chart here: https://2.bp.blogspot.com/-vLytmc_Nv_8/UFTcaVRo6eI/AAAAAAAAAqI/hfo1RK4XpY8/s1600/BASP.png

Skate.
 
Stock that has "ultra-high intra-day Volume" is not a measure I can use trading a weekly system. Ultra-high volume could be coded as an indicator of some value depending on the direction of the price movement.

Cheers M8 and thanks for the links etc.

Just to clarify re VWAP; It's not a measure of Ultra High Volume,

Rather just the price level at which the majority of Trading is/has been done at any given moment

Basically like a Moving Average of Price, but with Volume determining the "important"/most traded levels

As a quick example, VML Closed the other day at 078 but the daily VWAP was actually about 072-073

I noted on the VML Thread, that it didn't look quite right

Anyone who bought the spike high (well above the VWAP) were caught in a potentially weak position

Coincidentally, VML has dropped since the other day from 078 to 070

Like I said, I have no coding ability, but I'm sure using VWAP as a Filter in some way could possibly keep punters out of "false" trades where Price/short term Momentum says, it's a Buy, whereas in reality, it could be a fake-out.

Don't want to bog down the thread too much, but I believe

Someone with your coding ability might find a way to utilize it to your advantage:cool:

Then you could teach me how to use it, lol;)

Cheers:)


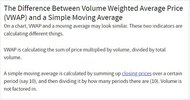
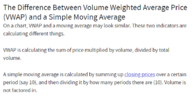
From Investopedia below:

1618274568315.png
 
Just to clarify re VWAP; Rather just the price level at which the majority of Trading is/has been done at any given moment
Basically like a Moving Average of Price, but with Volume determining the "important"/most traded levels - there might find a way to utilize it to your advantage:cool:

Summary Capture.JPG

Apologies to beginners (this series of posts is going to be a bit involved)
@barney, I can think of a multitude of ways how to code a trading strategy using the VWAP. The simplest way comes from the logic of your graph above (the summary of differences between the VWAP & SMA). The VWAP represents the “fair value” of the displayed share price.

Trade using the VWAP
The VWAP is easy to calculate as its the average sum of the price multiplied by volume. But here is the kicker "over what period" do we calculate the VWAP - that need to be determined by optimisation.

The simple way to use the VWAP
I could make it a simple exercise & buy when the price is below the VWAP, & sell when the price is above the VWAP but that would be too easy without any consideration to the ultimate goal.

What is the ultimate goal?
Barney suggested using the VWAP as a Filter - keeping "punters out of false trades". Reduction of "fake-out" is the ultimate goal.

More to follow.

Skate.
 
Top