Australian (ASX) Stock Market Forum

Dump it Here

Not complaining vs today, but i noticed my systems have a tendency to do well/very well on days where the asx is actually slightly down.has anyone noticed the same and has a possible explanation?
I understand i am highly small caps etc.
On big asx200 falls, the systems follow..
I have nothing concrete to back this up with. I wonder if slight down days in larger caps would see rotation into higher volatility stocks by day traders?
 
I have nothing concrete to back this up with. I wonder if slight down days in larger caps would see rotation into higher volatility stocks by day traders?

Not complaining vs today, but i noticed my systems have a tendency to do well/very well on days where the asx is actually slightly down.has anyone noticed the same and has a possible explanation?
I understand i am highly small caps etc.
On big asx200 falls, the systems follow..

Jumping at shadows
When the markets are having a down day there are those who want to fix something that not broken. Trading has a natural ebb & flow that affects everyone emotionally when they persist in one way or the other.

The Index you trade dictates the risk you are willing to take
When there are a few down days traders start clutching for straws trying to complicate trading. Nothing works perfectly so the next best thing is to accept that sometimes it works well & other times not so. I say just go with the flow & stop looking to answer a question that not being asked. (IMHO) It pays to keep trading simple.

Skate.
 
It pays to keep trading simple
I've recently posted about Nick Radge's simple "Day Trading Idea". The results are impressive because Nick keeps trading simple. In doing so, traders can understand that "trading need not be complicated". Nick also promotes his "Week-End Trend Trading Strategy" (WTT) which's is a simple 20-week breakout strategy. There is no easier trading than trading a trend.

You can't buy experience - Chat with Traders EP 178
For those interested in how to create a simple trend following system - this podcast may be for you. Nick goes on to explain his (WTT) 20-week breakout strategy (a simple trend following system). This podcast should be helpful for anyone interested in riding a trend. Even if trend following doesn’t overly appeal to you, then you’ll still pick up useful insight into trading systems.

Details are disclosed for his 20-week Trend Trader (WTT)
Nick details his strategic objectives & how he generations new trading ideas. What unique in this podcast Nick discusses the parameter setting for his (WTT) Strategy & goes on to discuss portfolio testing, how he analyses the results. Position sizing & risk management are also touched on.

This podcast is (1:28-minutes long) - but well worth a listen


Skate.
 
Jumping at shadows
When the markets are having a down day there are those who want to fix something that not broken. Trading has a natural ebb & flow that affects everyone emotionally when they persist in one way or the other.

The Index you trade dictates the risk you are willing to take
When there are a few down days traders start clutching for straws trying to complicate trading. Nothing works perfectly so the next best thing is to accept that sometimes it works well & other times not so. I say just go with the flow & stop looking to answer a question that not being asked. (IMHO) It pays to keep trading simple.

Skate.
That's a very philosophical view
why worry about unexpected gains indeed?
 
That's a very philosophical view
why worry about unexpected gains indeed?

To make money trading
Don't focus on making money - focus on protecting what you have. Trend followers react to price & never try to predict it. Trend trading revolves around rules of risk management & position sizing.

Chat with Traders EP 43 - with Jon Boorman
This is one of my favourite episodes about trend following. Jon explains how all traders start their journey by making mistakes & explains how successful traders respond to those mistakes. He also tackles how trend following is easy but not for everyone.

This podcast is (1:18-minutes long) - but well worth a listen


Skate.
 
We all have been there
I guess most new traders lose early on because of being too eager to earn big bucks but in doing so, end up losing money. Everyone wants trading to be fast & easy, jumping right in without having a plan (a recipe for disaster)

Listen & learn from the best
This advice never gets old.

Skate.
 
Trend following always looks easy
That’s because the principles are very simple. When looking at a trend following chart the entries & exits can look impressive, but what that chart won’t show you is the "emotional toll" trading such a strategy can take.

Trend followers expect & accept losers
The emotional effect can be enormous when dealing with a string of losers in a row. it's very hard to take the next trade or series of trades with the same confidence as the first. Confidence is the key ingredient when it comes to trading.

Confirmation of a trend can be a blessing & a curse
By its very nature, trend trading demands that a confirmed trend be firmly established before a trade can be entered. All trends need time to unfold & as a result, this style of trading typically has more losers than winners. Thankfully, letting the winners run & cutting the loser early will be the "edge" when trading this way.

Skate.
 
Trend trading is designed to capture price movements
It's important to remember that trends move on "differing" levels of volatility. Because we are at mercy of this volatility - it's the main reason why trend trading is such an emotional ride.

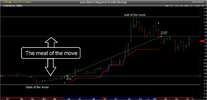
We are after the meat in the sandwich
When trend trading you have to "accept" trading this way you will give back a "proportion of open profits" knowing you will never capture all of the price movement - but that's not what it's designed to do. Trend trading allows you to get into a potential new trend (determined by timeframe & parameters) then get out when the trend doesn't develop or has run its course. Nothing more, nothing less.

Meat of the sandwich TLG Capture.JPG

Skate.
 
I was pondering today if good trend trading has to be a bit like driving while having to look through your rear-vision mirror. Presumably you would be doing this because the front windscreen is blackened, or damaged so badly you can barely see through it. It obviously wouldn't be wise to travel too fast - perhaps another corny analogy there for how important it is to keep position size risk under control. It should be possible to travel long distances like this once you master the rules of left/right (in reverse) and concentrating on where the road has been as your best hint of where to drive next. :unsure:

A quick Google shows arguments for and against this approach to investing, including the might Warren B:


It might be possible to extend this idea further to explain why some people prefer to take an early contrarian view on the markets, antcipating a market reversal and getting on board a new trend early. Whatever that is, it isn't "capturing the meat of the move", and its not trend trading.....

The more I think about it there IS an analogy here, and the human brain is not wired to enjoy driving while looking out the back window.

End of dump.....
 
It might be possible to extend this idea further to explain why some people prefer to take an early contrarian view on the markets, antcipating a market reversal and getting on board a new trend early. Whatever that is, it isn't "capturing the meat of the move", and its not trend trading.....

Confirmation of a trend can be a blessing & a curse
@Newt, I was with you right up to the paragraph above. Trend trading by its very nature means you will always get in a little late because of trend confirmation. Getting off the ride also requires confirmation that the trend has stalled or reversed. For this reason, the very best we can hope for is between the start & end of the trend, ( the meat of the trend). My terminology might not be sufficiently accurate in describing the area between the top & bottom of the trend, but I would believe most would get the analogy. Those who struggled to get the reference a picture was attached.

trend following is easy but not for everyone.

Newt, an expanded explanation from you would be helpful
So I can understand what you don’t understand. I’ve made 6 posts to explain a trading Strategy that has served me well. I’m thinking if trend trading is good enough for Nick Radge & Jon Boorman, it good enough for me - while acknowledging this style of trading is not for everyone.

Skate.
 
There was some recent discussion here about the relatively low win rate (<50%) associated with breakout based systems. If you don't like the low win rate with vanilla breakout systems I thought I'd give you something to investigate if you want an improved win rate for your breakout system.

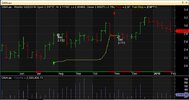
This applies to breakout systems that employ a typical stop loss (which seems reasonably common among retail system traders) and for the purposes of this post the entry (breakout) condition is irrelevant. The first chart below shows why some of these breakout system have low win rates. They give up gains and are exited when the stop loss is hit. You may often hear let the phrase "let the winners run" and while this does have some merit it does have a downside. You can see from the chart below that this winner was left to run but is closed out in the red :mad: Sure, we could employ more sophisticated stop loss mechanism, but this post is not about improving stop losses.

BO Problem.JPG

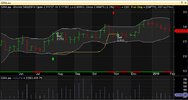
There is some statistical logic that suggests as prices move to extremes they will revert back to their mean. If this sounds familiar it is the basis of mean reversion systems. So, let's apply that logic to the above GWA chart and see if we can turn it into a winner. The trusty old Bollinger Bands are a good indicator of price extremities. The chart below has Bollinger Bands overlaid on the price and in this case the upper and lower bands represent 2 SD. This basically means that any close price above the upper BB is an outlier and assuming mean reversion holds true the price in the following bars is likely to pull back towards the lower average. For the statisticians here let's argue another day whether close prices conform to a Gaussian distribution.

You can see in the chart below that the third bar before the stop loss "Sell" that the close of the day closed above the upper BB and sure enough the following bars pulled back. If only we closed out the GWA position following the break of the upper BB this position would have closed out a winner.

BB overlay.JPG

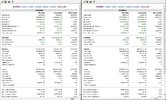
The above is all well and good in theory so let's see what it does on a more broader scale. I ran some simulation of a breakout system with and without the BB exit. Below are the initial results. Results on the left are for the system without the BB exit and the results on the right are the system with the BB exit. Headline observations include: improved net profit, slightly reduced exposure (makes sense given the significantly reduced hold time for winners), a lot more trades (again, makes sense given the significantly reduced hold time for winners), average profit per trade significantly reduced (makes sense since we are exiting earlier and probably giving up gains that come from longer hold times, but compensated my more trades), over 10% increase in winners, more consecutive losers, and not a lot of difference in system drawdown.
Results.JPG

The below represents AB's MC analysis. Again, results on the left are for the system without the BB exit and the results on the right are the system with the BB exit. I think these MC results speak for themselves.

MC results.JPG
So in summary -- if you trade breakout systems and your only exit is a plain old vanilla stop loss why not look at augmenting your system with a "profit exit" because sometimes letting your winners run without a leash can turn them into losers. I'm not specifically advocating BBs but rather using it here for illustrative purposes.

Stay Classy ASF.
 
There was some recent discussion here about the relatively low win rate (<50%) associated with breakout based systems. If you don't like the low win rate with vanilla breakout systems I thought I'd give you something to investigate if you want an improved win rate for your breakout system.

This applies to breakout systems that employ a typical stop loss (which seems reasonably common among retail system traders) and for the purposes of this post the entry (breakout) condition is irrelevant. The first chart below shows why some of these breakout system have low win rates. They give up gains and are exited when the stop loss is hit. You may often hear let the phrase "let the winners run" and while this does have some merit it does have a downside. You can see from the chart below that this winner was left to run but is closed out in the red :mad: Sure, we could employ more sophisticated stop loss mechanism, but this post is not about improving stop losses.

View attachment 122834

There is some statistical logic that suggests as prices move to extremes they will revert back to their mean. If this sounds familiar it is the basis of mean reversion systems. So, let's apply that logic to the above GWA chart and see if we can turn it into a winner. The trusty old Bollinger Bands are a good indicator of price extremities. The chart below has Bollinger Bands overlaid on the price and in this case the upper and lower bands represent 2 SD. This basically means that any close price above the upper BB is an outlier and assuming mean reversion holds true the price in the following bars is likely to pull back towards the lower average. For the statisticians here let's argue another day whether close prices conform to a Gaussian distribution.

You can see in the chart below that the third bar before the stop loss "Sell" that the close of the day closed above the upper BB and sure enough the following bars pulled back. If only we closed out the GWA position following the break of the upper BB this position would have closed out a winner.

View attachment 122838

The above is all well and good in theory so let's see what it does on a more broader scale. I ran some simulation of a breakout system with and without the BB exit. Below are the initial results. Results on the left are for the system without the BB exit and the results on the right are the system with the BB exit. Headline observations include: improved net profit, slightly reduced exposure (makes sense given the significantly reduced hold time for winners), a lot more trades (again, makes sense given the significantly reduced hold time for winners), average profit per trade significantly reduced (makes sense since we are exiting earlier and probably giving up gains that come from longer hold times, but compensated my more trades), over 10% increase in winners, more consecutive losers, and not a lot of difference in system drawdown.
View attachment 122840

The below represents AB's MC analysis. Again, results on the left are for the system without the BB exit and the results on the right are the system with the BB exit. I think these MC results speak for themselves.

View attachment 122846
So in summary -- if you trade breakout systems and your only exit is a plain old vanilla stop loss why not look at augmenting your system with a "profit exit" because sometimes letting your winners run without a leash can turn them into losers. I'm not specifically advocating BBs but rather using it here for illustrative purposes.

Stay Classy ASF.
Just to say thank you MA, short and consive, argumented, 5 stars?
 
Just to say thank you MA, short and consive, argumented, 5 stars?
:xyxthumbs

I should probably add that I was able to easily push the win rate up to 60% by reducing the BB from 2 SD to around 1.5 SD. This closed out positions much sooner but did come at a reduction of around 30% of the net profit. Still very acceptable net profit and comfortable 60% win rate.
 
Confirmation of a trend can be a blessing & a curse
@Newt, I was with you right up to the paragraph above. Trend trading by its very nature means you will always get in a little late because of trend confirmation. Getting off the ride also requires confirmation that the trend has stalled or reversed. For this reason, the very best we can hope for is between the start & end of the trend, ( the meat of the trend). My terminology might not be sufficiently accurate in describing the area between the top & bottom of the trend, but I would believe most would get the analogy. Those who struggled to get the reference a picture was attached.


Newt, an expanded explanation from you would be helpful
So I can understand what you don’t understand. I’ve made 6 posts to explain a trading Strategy that has served me well. I’m thinking if trend trading is good enough for Nick Radge & Jon Boorman, it good enough for me - while acknowledging this style of trading is not for everyone.

Skate.


Hi Skate,

My last post was isolated "dump it here" musings, nothing specifically referenced against your recent posts and certainly no torpedos in there. It was really just another way of looking at the challenges of trend trading - something we know has relatively straight-forward rules (or should have) but is not necessarily "easy" to trade.

I've always admired your ability to find trends early, but my last paragraph wasn't about that. There are traders or macro-economic specialists that try to specialise in identifying market turning points before they occur. There's no "wrong" approach to investing or trading if it has a demonstrable edge and works for that trader, but any attempt at forward prediction in this manner is not trend trading. Perhaps we're drawn to try and predict patterns because our minds are programmed to identify risk and patterns from an evolutionary perspective (find the face hidden behind the leaves). I'd have to go digging, but there was a Chat with Traders podcast some time in the last 12 months where the guest "had a go" at trend traders essentially being too passive and not willing to work harder to predict macro-economic turning points in advance of the market itself turning.

Trend trading rules can however only act on historical data. That data may be as fresh as the single last bar of your chosen timeframe, but it is still only visible "from the rear-vision mirror", and we have to accept that. Kudos that you seem to be able to pick a turn in the road and respond a bit quicker to a new trend than most.

A favourtie quote on trend trading was from Brett Penfold's book "The Universal Principles of Successful Trading". He warns in there that although trend trading is an important tool and one approach to trading, the less than 50% win rate will mean the trader is usually in drawdown and feeling somewhat "miserable". He wasn't warning traders off, just doing what you've done here many times before Skate - try to warn new traders that the road ahead is long and winding and not easy.


With that low win rate in mind, I'll have to have a closer read of MovingAverage's last post now.....
 
Just to say thank you MA, short and consive, argumented, 5 stars?

Yes, more thanks from myself too MA for such a well written proposal on melding trend trading with a possible "take profit" exit based on Bollinger Bands. You've rightly pointed out that the shorter trade with the more aggressive exit may end up with a steeper gradient (of price versus time), but ultimately less total profit versus a longer term less aggressive exit. The best case scenario would presumably be using that earlier exit to quickly get into more "steeper gradient" short term trades.

Something I've noticed previously while playing with these sorts of exits is the potential to contain drawdown. We tend to think DD's occur as a result of market pullback (and of course they do), but a significant pullback at the end of a long trend for a couple of multi-bagger holdings can also put a big dent in your equity curve.

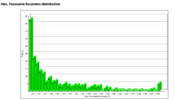
Another way of visualising this is via the Max Favourable Excursion distribution curve. Do you hold out for those infrequent but many-fold long term high winners (the >200% bar on the graph below) and in doing so risk giving back quite a bit of open profit at the exit, or be willing to give up some of those big winners and replace them with (hopefully) a few smaller winners. This should then give a smoother curve in the <200% profit portion of the graph, and less nasty DD bumps in the equity curve.

Everyone has to find their own preferred compromise in the end.


1618536761033.png
 
Yes, more thanks from myself too MA for such a well written proposal on melding trend trading with a possible "take profit" exit based on Bollinger Bands. You've rightly pointed out that the shorter trade with the more aggressive exit may end up with a steeper gradient (of price versus time), but ultimately less total profit versus a longer term less aggressive exit. The best case scenario would presumably be using that earlier exit to quickly get into more "steeper gradient" short term trades.

Something I've noticed previously while playing with these sorts of exits is the potential to contain drawdown. We tend to think DD's occur as a result of market pullback (and of course they do), but a significant pullback at the end of a long trend for a couple of multi-bagger holdings can also put a big dent in your equity curve.

Another way of visualising this is via the Max Favourable Excursion distribution curve. Do you hold out for those infrequent but many-fold long term high winners (the >200% bar on the graph below), or be willing to give up some of those to get a smoother curve in the <200% winners portion of the graph. Everyone has to find their own preferred compromise in the end.


View attachment 122848
Thanks @Newt. I agree entirely with what you're saying about DD. For my trading style, I am definitely not chasing those infrequent many fold long term winners. As I mentioned before in this thread, I like to chase consistency of returns and this typically comes from taking a higher percentage of smaller (but consistent) per trade profits and forgoing those really big winners. Can't have your cake and eat it :roflmao: I've found chasing those infrequent big winners tends to introduce more volatility in returns--and I guess this is your point regarding a smoother equity curve. Each to their own, but for me frequent smaller profits is what I want.
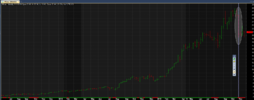
 
Thanks MA. That shows the trade-offs and gains very clearly, and you're obviously much more comfortable trading "on the right hand side".

Part of what I love about trading are the lessons it teaches you about yourself. Newt 3 years ago would have said "I want those big winners dammit". Newt 2021 knows they have an uncanny habbit of being in backtests but escaping the net in real lfe - so now more inclined to aim somewhere between your two graphs.

e.g. Giving back a huge chunk of open profits on JIN in late 2019 in one week. The market doesn't always reward those that hang in there for the long haul alas.....

1618540212747.png
 

Attachments

  • 1618540169028.png
    1618540169028.png
    135 KB · Views: 17
Thanks MA. That shows the trade-offs and gains very clearly, and you're obviously much more comfortable trading "on the right hand side".
While I'm not live trading the BB example I posted about I am live trading the system with a different profit exit. Yes, the righthand side is where I like to be, but the other thing about my trading style is that I'm not comfortable with the very long hold times that are typical with many trend trading system. The thing I like about the profit exit is that it does give me drastically reduced hold times. Ouch on JIN
 
Giving back a huge chunk of open profits on JIN in late 2019 in one week. The market doesn't always reward those that hang in there for the long haul

View attachment 122853

Trading is a compromise
Two strategies that I trade "visually displays" what @MovingAverage & @Newt has been describing. The charts below are the actual positions taken by the Sphere Strategy & The Switch Strategy.

Entries are the same but the exit strategy differs
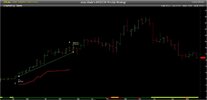
Meaning, they both behave differently. Newt's example using (JIN) is perfect to show the difference between exits. (Stale & Trailing stops in action)

# 1. Stale Stop
A stale stop can be a blessing at times. The exit was from "volatility stalling". I should say, I use Bollinger Bands in a unique way as one of the indicators to confirm a position is stalling or has stalled. It's a time-driven Stale exit in this example

JIN - StaleStop Capture.JPG


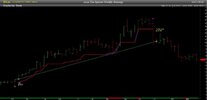
# 2. The Sphere Strategy
This Sphere Strategy exited the position by a trailing stop. The "Index driven" variable trailing stop saved a proportion of open profits. Huge down bars are just part of this game.

JIN - StaleStop Sphere Capture.JPG


Jon Boorman once said:
"The worst thing an investor can find out during a bear market is that their strategy doesn’t suit their personality".

Jon also said:
"In essence, the #1 thing that is absolutely critical to a trader’s success are risk management, psychology, passion & discipline.

Skate.
 
Last edited:
Top