Australian (ASX) Stock Market Forum

Dump it Here

New traders attracted to the obvious break-out trading style become quickly disillusioned when their W% falls below 50%. They think they're doing something wrong. I've had people wonder why my long term W% isn't >50% if I'm a good trader. I was going to comment that one can increase the W% of a trend following system by taking smaller profits. Pleased to see that you realise this and you also know the cost of doing this (less profit).

so, the obvious question:
why would anyone prefer win rate over profit?


Personally, I don’t care about win rate. It doesn’t mess with my head on a day to day basis when live trading and it is certainly not high on my list when accessing systems.

Low win percentage
I made a series of posts about why "trend trading systems" have a low win rate. I also said that the "win percentage" of my combined trading results fell within acceptable limits for a trend trading strategy. I accept a low win rate for a trend system is just the nature of the beast.

At the other end of the spectrum
Trading a "mean reversion strategy" has a high win rate with lower returns. You can have it both ways.

I want to explore why "trend trading systems" have a low win rate.

To increase your win percentage, you have to accept lower profits
I'm not a fan of that quote but for some, it makes perfect sense. We all need to trade a strategy we are comfortable with. The last few weeks have been tough "trading a breakout strategy" but this week's results (so far) make us look like trading geniuses.
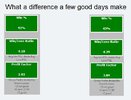
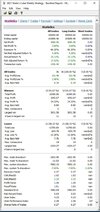
600 COMBINED trades Capture.jpg

I think your systems have done a stellar job.

@ducati916, thank you for your kind appraisal.

Skate.
 
And just to add a common sense concept.with 40 positions, each position for people like me is half the size($)
So higher commissions fees ..true, but also much easier to be filled and less influence on price for low volume,high volatility shares.
And better risk management.
I personally start getting edgy with 7k positions in such companies
 
Received a befitting email with regards to position sizing from nick radge (if you're subscribed to his mailing list you would of too). if you haven't here it is. A very interesting concept about distribution of risk. Anyone ever tried it? This is a straight cut and paste

There are many different ways to grow an account. Using a linear method such as Fixed Fractional position sizing will do it, albeit slowly and surely. The key to growing the account is that you need to take on more risk, and taking on more risk means exposing oneself to a higher drawdown.

Drawdowns on paper are easy to digest, but in real life, there is a lot more emotional baggage to be carried. So first and foremost think long and hard about how much drawdown you can withstand.

What we have found that works with growing an account faster, is to divide capital into two pools, Initial Capital (IC) and Realised Profits (RP).

Step 1:
IC is the initial capital you decide to employ. With this capital, you will use a standard position sizing model, such as Fixed Fractional Fixed Percentage allocations.

Step 2:
Trade the strategy using the chosen position sizing model until you have a 10% realised profit. Assume $100,000 as IC which is now $110,000.

Step 3:
Move 50% of the profit into pool RP. IC is now $105,000 and will continue to be traded with your chosen position sizing method.

Step 4:
RP is now $5,000 and it's this pool that we'll be trading aggressively. Calculate the Kelly% (K%) across the last 100 trades. For this example we'll assume K% = 20%. In theory, and in the context of what K% was designed for, you would trade the RP with 20% risk per trade. However, in reality, we're going to trade 0.5*K%, or 10%.

At this point, assuming fixed fractional position sizing, the next trade risk will be:
IC = 0.02 * 105,000
RP = 0.10 * 5,000
Total risk = IC + RP = $2,600

Step 5:
Now we need to start re-balancing across both accounts. Therefore,
(a) When the balance of IC increases by another 10%, i.e.$115,500, move another 50% of those profits across to the RP account.
(b) When the RP account value is 50% of the IC account value move 50% back to the IC account and trade the new value with your chosen position sizing model.

If we continue to trade the RP account at the 0.5*K% level it will eventually make the IC account meaningless and the volatility starts growing exponentially. By redistributing the funds back we keep the broad volatility down, in other words, the aggressive RP account starts to feed the conservative IC account, and should a drawdown come along it won't set the total portfolio back too far.

Obviously, there are many ways to accommodate account growth but the bottom line is that more risk is required and ideally that risk should be calibrated to some extent so as not to blow the account out or cause irreversible psychological damage.
I just got the email too. It’s very interesting and I’m curious to explore the outlined methodology ?
 
So I thought I'd do a rough and ready analysis of a true random system. Here are the results....not very pretty is it? Think I'll pass on taking tips from a monkey throwing darts at a list of stocks or give serious consideration to a random trading approach. Unlike other so called random systems, my simulations were across all ASX equities (not just carefully selected constituents of a major index). My buys and sells were not carefully timed to occur at the start/end of a particular period (start/end of month). The system just made a random decision at the end of every day whether to buy or sell. To keep things simple I started with $100k capital and traded fixed $ amounts of $5000 for a maximum number of consecutive positions of 20. Trade commission was $15. I also used position size shrinking where I didn't have enough capital to take a position. I ran the simulations from 1/1/2000 through to 9/4/2021. Every single run outside of the 99 percentile lost money and that was for a 1000 runs--so 99% of the 1000 runs were losers. I'll pass on random systems.


Random System.JPG
 
So I thought I'd do a rough and ready analysis of a true random system. Here are the results....not very pretty is it? Think I'll pass on taking tips from a monkey throwing darts at a list of stocks or give serious consideration to a random trading approach. Unlike other so called random systems, my simulations were across all ASX equities (not just carefully selected constituents of a major index). My buys and sells were not carefully timed to occur at the start/end of a particular period (start/end of month). The system just made a random decision at the end of every day whether to buy or sell. To keep things simple I started with $100k capital and traded fixed $ amounts of $5000 for a maximum number of consecutive positions of 20. Trade commission was $15. I also used position size shrinking where I didn't have enough capital to take a position. I ran the simulations from 1/1/2000 through to 9/4/2021. Every single run outside of the 99 percentile lost money and that was for a 1000 runs--so 99% of the 1000 runs were losers. I'll pass on random systems.


View attachment 122607
Oh, and I included historically listed stocks to avoid survivorship bias.
 
Oh, and I included historically listed stocks to avoid survivorship bias.
MA,
I did same, whole of asx200,weekly system
100k 5k position, 20 positionspure random buy sell is losing money mostly due to brokerage costwas durprised how good it was

Then tweaked with:
random buy of any stock closing week higher than started,
sold any position closing week lower than starting
add an index gtfo and you are making money...
I found that scary not to say moral saping vs years of trying to get an "edge.."..
Obviously, the fact markets always go up helps...and yes they do due to inflation on any long term perod


i was able to
 
I thought Warr87 put it welll the other day - we don't always have to shoot the lights out to beat broader market or super fund returns. Peter2 large cap thread has a similar theme. Will be interested to see how both hold up long term as potentially this is another form of diversification for future capital and profits - move to more conservative slower growing and hopefully low DD strategy.

Guess that's what the Bee investment strategy is too in a way.....


Month 8

Beginning of month 8. Like my weekly system, and CFD trading, I lost half of my open profits recently. I am liking this strategy though. I look forward to the EOM to adjust the portfolio and see how it is going. While technically doing worse than the XKO now, I think it will be a short setback. Still at approx 10% returns. Talking to friends, they find this return to be amazing. It s nice to talk to non-traders and have it in perspective that with just a few trades at the end of the month I can do better than most. I am confident that my system will end the year closer to 20% return. All speculation but I genuinely think it is doing well.
 
So I thought I'd do a rough and ready analysis of a true random system. Here are the results....not very pretty is it? Think I'll pass on taking tips from a monkey throwing darts at a list of stocks or give serious consideration to a random trading approach. Unlike other so called random systems, my simulations were across all ASX equities (not just carefully selected constituents of a major index). My buys and sells were not carefully timed to occur at the start/end of a particular period (start/end of month). The system just made a random decision at the end of every day whether to buy or sell. To keep things simple I started with $100k capital and traded fixed $ amounts of $5000 for a maximum number of consecutive positions of 20. Trade commission was $15. I also used position size shrinking where I didn't have enough capital to take a position. I ran the simulations from 1/1/2000 through to 9/4/2021. Every single run outside of the 99 percentile lost money and that was for a 1000 runs--so 99% of the 1000 runs were losers. I'll pass on random systems.


View attachment 122607


A few things to highlight

Your commission is 0.33%, currently IB are 0.088%. incl GST

Trading 20 positions, you have roughly 100,000 random selection events ( not trades just potential events). 20 per day *250 per year *21 years.

I don't know your sell condition but If your sell condition is "Sell = random()>.5;" you are turning over 50% of trades, that's 10 buys and 10 sells per day, and giving up 0.33% of your account each day to commissions. Not saying that's what you do

Turning to the actual market.

The XJO (asx200 index) made on average 3.62% PA over that 21 year period, that's an average growth of 0.014% per day.

To break even and overcome commission losses, you will need to limit trade frequency to 1/40 .... (1 trade in your 20 position portfolio per 2 days) your sell condition should be "Sell = random()>.975;"

If you change it to a weekly system, the average per week the index makes increases to .067% .... your trade frequency increases to 2.5/20 per week or "Sell = random()>0.9;"

This should get you to break even point using the XJO as a reference.

Now if you suddenly find that you are making money ( even 1% PA ), then the random market as a whole is beating the reference index. If you are losing money, then the random market is falling behind the reference index. ( If my maths is right ).
 
I've been thinking.PNG

Interesting topics have a habit of drawing in comments from the more experienced
It's great to see topics (about all things trading) being discussed & the merits debated. To a beginner, this can be at times overwhelming & downright confusing but the more seasoned readers would be taking a greater interest in the topics being posted.

How to make money in the markets (trading or investing)
Watch YouTube video's & you'll be bombarded with "100%" foolproof methods that will make you extremely wealthy (for a price). I've only found one method (for me) that constantly generates a positive return over the long run, that being "system" trading.

System trading
Mechanical trading systems are systems that generate trade signals for a trader to take. They are called mechanical because a trader will take the trade regardless of what is happening in the markets. My all-time favourite is "Trend trading" which is simply trading with the majority.

Trend trading
It's a matter of finding a trend, riding it until it runs out of puff, & get off. Rinse & repeat - looking for the next ride.

A recent question - "I want to start trading where should I start?"
Well, the obvious is to read the "Dump it here" thread. My posts have also been condensed into an eBook. But for those who are time-poor, there are ways to "short sheet" the learning process.

How?
By "buying a proven strategy" & trade it with small amounts at first until confidence allows you to trade the strategy with larger positions. If the strategy has positive returns over time, stay with it (as something is better than nothing). Those chasing higher returns will take on more risk but that comes much later in the trading process.

T.I.N.A
The bar is set so low at the moment, a perfect time to have a go (at trading) as most other investments are returning next to nothing (real estate excluded)

Skate.
 
Experience is not required
Let's face it, trading is risky. The learning curve to develop a trading system is steep for the average trader but not impossible. The very first step towards success in any occupation is to become interested. For all the others who want to start trading straight away "buy a proven system" & accept what the market will give trading it.

Skill & experience
Trading like @tech/a, @peter2 & @frugal.rock takes skill & experience, whereas mechanical system trading takes a deal of courage & commitment.

Trading requires a great deal of detachment from money
When starting to trade for the very "first time" take small positions so you can take losses without "flinching". Most new traders will start out undercapitalised & are unable to handle losses, that's the reason to start out small. Beginners tend to gyrate from one idea to another based on what they think is going on in the market or what they have read or heard. At times, emails & the media are not your friends, take whatever they say with a “grain of salt” until you have a solid handle on what they are saying & for whose benefit. Content disguised as information is nothing more than SPAM.

Trading is easy, making money is the difficult part
Trading consistently & successfully is even harder, which is why the majority of people who try to make money from trading fail. Having a trading plan somewhat eliminates this, tilting the odds in your favour. I'm saying. if you have nothing else, have a "trading plan"- one to succeed rather than to fail.

Skate.
 
This is a new concept for me
Over the years I've found great joy in combining strategies, the best of the best "as to say". Recently with all this talk about the "edge" & the randomness of returns, had me re-evaluating my current pool of thoughts. @ducati916 posts certainly got me thinking in a different direction. Duc's posts are always informative & motivational. Reading new ideas & different approaches is how we challenge ourselves to improve our trading.

I prefer rock-solid returns
Chasing higher returns always comes with a higher risk. When chasing respectable returns there has to be a trade-off. Accepting lower returns in a roaring market is the price you pay. On the flip side when trading gets tough it's a lot easier to handle the lower drawdowns. Aggressive strategies gyrate between eye-watering returns & large drawdowns. (you can't have it both ways)

Combining two solid performers
When I first thought of this scenario, I wasn't too fussed about the idea as I'm addicted to good returns. It was a simple marriage between my "BlueWren Strategy" (a simple breakout strategy) & my "ConnorRSI Strategy" - both solid performers in their own right. There are unique nuances between the strategies but the main difference is one uses an index "buy filter" where the other doesn't.

The "Cube Weekly Strategy"
Trading a "rock-solid" strategy rather than a "rock-star" strategy has some merit as it balances out the emotional roller coaster of returns. The "Cube Strategy" is worthy of paper trading on its initial backtest results.

Backtest Period (1st January 2021 to 9th April 2021)
The backtest results below demonstrate how it handled a "poor trading period" from the start of this year.

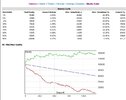
Cube Capture.JPG

Food for thought.

Skate.
 
A few things to highlight

Your commission is 0.33%, currently IB are 0.088%. incl GST

Trading 20 positions, you have roughly 100,000 random selection events ( not trades just potential events). 20 per day *250 per year *21 years.

I don't know your sell condition but If your sell condition is "Sell = random()>.5;" you are turning over 50% of trades, that's 10 buys and 10 sells per day, and giving up 0.33% of your account each day to commissions. Not saying that's what you do

Turning to the actual market.

The XJO (asx200 index) made on average 3.62% PA over that 21 year period, that's an average growth of 0.014% per day.

To break even and overcome commission losses, you will need to limit trade frequency to 1/40 .... (1 trade in your 20 position portfolio per 2 days) your sell condition should be "Sell = random()>.975;"

If you change it to a weekly system, the average per week the index makes increases to .067% .... your trade frequency increases to 2.5/20 per week or "Sell = random()>0.9;"

This should get you to break even point using the XJO as a reference.

Now if you suddenly find that you are making money ( even 1% PA ), then the random market as a whole is beating the reference index. If you are losing money, then the random market is falling behind the reference index. ( If my maths is right ).
I think you're comments are highlighting exactly the issue I have. You are making refinements to what I believe is a better indication of a true random system to improve it by address key issues with randomness and those improvements are introducing an edge. For example you're suggesting moving to a weekly time frame to reduce trade frequency and then using XJO as a reference. I understand what you're saying and I'm not disputing that it doesn't make sense but to move beyond that and say a random system can beat the index, well I have my reservations. The simulation results I posted clearly show that in about only 1% of cases can a random system even generate 0.5% profit over 20 years. Now we can certainly start discussing characteristics of that random system such as trade frequency, time frames etc etc to see if we can improve some of it's undesirable characteristics but to me that starts to move away from a true random system. And yes it may well be possible to approach Index returns, but as I say all that is being done there is to address some of the negative impacts randomness has to boost returns. BTW, I think you review is correct and I'm not disagreeing with it.
 
How to make money in the markets (trading or investing)
Watch YouTube video's & you'll be bombarded with "100%" foolproof methods that will make you extremely wealthy (for a price). I've only found one method (for me) that constantly generates a positive return over the long run, that being "system" trading.

System trading
Mechanical trading systems are systems that generate trade signals for a trader to take. They are called mechanical because a trader will take the trade regardless of what is happening in the markets. My all-time favourite is "Trend trading" which is simply trading with the majority.


Skate.

I found this post interesting for the following reason: the words 'system' and 'mechanical' are used interchangeably for a single meaning. This, as I will explain is actually potentially very confusing to traders who divide the trading world into systems traders and discretionary traders as not everyone is on the same page with regards to what is actually being discussed.

Definitions: (a) system: a combination of things or parts forming a complex or unitary whole, correlated members and (b) mechanical: synonym 'automatic' from the root automatos or 'self-thinking'.

To my mind they are different. Certainly in the market, they are different. I trade 2 mechanical strategies. They are not systems. The market moves, numbers (market prices) go into the engine, the engine spits out buy or sell. No different to @Skate 'systems'. Well yes, actually very different. One @Skate buys and sells over a period of time possibly hundreds of stocks. I on the other hand deal with only 1 but more usually 2, which is (are) adjusted mechanically.

The fundamental difference is one (the system) is directional, the other (mechanical) is market neutral. Trend trading, as pointed out, is trading with the majority. Mechanical trading is trading against the majority. The two methodologies/strategies, are completely mirror opposites.

Which returns me to one of my original observations re. systems traders and discretionary traders: as we have seen in this thread, @Skate and some others have recommended having different systems for different markets, the important point being that the transition from system A to system B seems to be driven by the systems themselves.

The BIG difference, which we have now touched on re. 'an edge', 'random systems', changing nature of markets, loss of an edge, etc. is that a system is a design by a designer: ie. you. A mechanical strategy, is not a design by a designer, it is inherent to markets themselves, ie. it is self adjusting or 'self-thinking'. Which is not to say it is risk free. Nothing is risk free.


jog on
duc
 
CUBE Strategy JOINED.jpg

Inspiration from others
I've watched a recording of "Pen & Teller" over lunch. Low & behold there was a magic trick using Rubik's cubes. As my "Cube Strategy" is a marriage of two strategies - what could be more fitting than joining two Rubik's cubes together. I get inspirations from others & the logo for my new strategy appears to be no different.

Skate.
 
'an edge', 'random systems', changing nature of markets

Changing nature of markets
Having an "edge" might be an accepted "catchphrase" when trading is going gangbusters. When trading is performing badly, we readily accept that our strategy has lost its "edge" & we set about improving it.

How?
By fiddling with a perfectly good strategy "without" knowing what the "edge" is or what having an "edge" really means. Luck, randomness, market timing, could be all tributers to my trading performance.

Perseverance
One thing I do know that I possess in spades is "perseverance" - maybe that's my edge.

Skate.
 
The ratio of signals
When there are more buy signals than sell signals, which indicates "to me", the markets are on the improve.

I couldn't let this observation go without posting my total agreement. Readers of my spec portfolio thread may remember that during the past month I've mentioned that I'm not seeing many "perfect" setups. The number of open trades dropped to a low number (10) and I wasn't seeing many good opportunities.

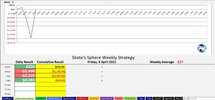
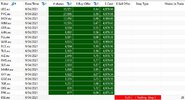
This week I've added five new positions. I anticipate adding a few more next week. Lo, @Skate shows that his Sphere system has found more signals than normal this week.

Perhaps system traders may like to think about monitoring the number of signals their system generates each week as an indicator of current market conditions. When conditions are good there'll be lots of signals and when the number of signals falls below a threshold number this can be an indicator that market conditions have changed.

I think this idea may be a better mechanism than an index filter because the index is so market cap heavy.

Allow me to roll on with this idea. . . we know that market conditions change and that it's better to have a few systems that work in different market conditions. Lets' say we've a price momentum system (it could be a break-out system) and a reversal system. In bullish markets the break-out system is finding heaps of signals while the reversal system is finding few. We recognise this at the time and allocate most of our resources (capital) to the BO system. After a market selloff (eg. Covid Mar20) our BO system finds nothing but the reversal system is finding heaps. We allocate most of our resources to the reversal system until market conditions change.

I think that monitoring the number of signals found by these two systems could be a valuable switching mechanism that may work much better than an index filter alone.
 
Top