Australian (ASX) Stock Market Forum

Dump it Here

This is exactly the same as the applystop function:
ApplyStop is actually a pretty tricky function to handle especially in a weekly system as it's assuming you are using a conditional order at your broker on a daily/intraday basis.

ApplyStop function is designed to be used to simulate
stop orders placed at the exchange or simulated by the brokerage

ExitAtStop = 1 - check High-Low prices and exit intraday on price equal to stop level on the same bar when stop was triggered
ExitAtStop = 2 - check High-Low prices but exit NEXT BAR on regular trade price.
If using ExitAtStop = 1 the order executes intraday.
In the case of ExitAtStop = 2 the NEXT BAR is actually indicating the next bar in your actual data. In the case of Norgate Data that would be the next day as Norgate is in a daily format. The ApplyStop will ignore your Weekly/Monthly settings.

It will also ignore any SetTradeDelays be it in the code or settings as ApplyStop is simulating a brokers conditional order.

In a backtest an ApplyStop used in a weekly setting may even seem to be looking at future data.
With ExitAtStop = 2 sell orders that were triggered between Mon-Thu(16/3-19/3 example dates) will be consolidated into the current weekly bar (16-20/3 -> 20/3 weekly bar) as the NEXT BAR is Tue-Fri (17-20/3).
An order triggered on Friday(20/3) will be in next weekly bar (22-26/3 -> 26/3 weekly bar) as Next Monday(22/3) is the NEXT BAR.

The issue is in the first instance where the trades are made in the current weekly bar.
Code:
BuyPrice = Open; //Buy the next day at open
SellPrice = Open; // Sell the next day at open
If you use this code to set the sell price to the Monday open auction price (16/3 in a 20/3 weekly bar) a sell triggered on say Thursday (19/3) will be using the price on Monday (16/3).
So a future trigger is selling at Monday's price.

Code:
SetOption( "MaxOpenPositions", PosQty); // Maximum number of open position
This also affects buy orders if it is limited by the number of positions. As the trade had exited on the current weekly bar a new position can be entered during the current week on Monday's price.
So a future trigger is initiating a buy order a week earlier.

Code:
ts1 = 20; // Trailing stop one = set at 20% when the Index Filter is TRUE
ts2 = 10; // Trailing stop two = reduces to 10% when the Index Filter is FALSE
ts = IIf( indexbuyfilter , ts1 , ts2 ); // If the Index Filter is TRUE use (ts1) set at 20%, if the Index Filter is FALSE use (ts2) settings reduce Trail Stop to 10%

ApplyStop( stopTypeTrailing , stopModePercent , ts , exitatstop = 2 );
Also if you use a tiered trailing stop as used by Skate it can't even be implemented using the broker's conditional order as the narrower trailing% needs an Index Filter as one of its conditions. (Or you need to change the trailing% every week depending on the Index Filter.)

I would like to do it without the applystop function; as the applystop doesnt spit out trades in explorer.
The first instance uses a loop instead of ApplyStop. This is the best way to go for a weekly system.

The second example uses Equity(1) to output all the Sells from ApplyStop but still has all the issues I've stated above.
 
Here's a quick modification of the trailing stop code to use for Profit Stops. (Not tested)

(It's AFL and not javascript but close enough.)
JavaScript:
amount = 100; // 100% profit

Buy = Cross( MACD(), Signal() ); //Change to whatever
Sell = 0;
profitStop = 0;

for( i = 1; i < BarCount; i++ )
{
   if( profitStop == 0 AND Buy[ i ] )
   {
      profitStop = BuyPrice[i] * (1 + amount/100);
   }
   else Buy[ i ] = 0; // remove excess buy signals

   if( profitStop > 0 AND High[ i ] > profitStop )
   {
      Sell[ i ] = 1;
      SellPrice[ i ] = profitStop;
      profitStop = 0;
   }
}
Sell=Sell OR C>=BuyPrice*2;
Use (H)igh instead of (C)lose depending on if you want to sell because it reached the price or to sell at the actual price.
 
The reason i ask. i was in an open position and at the end of the week was %140 percent profit. Really nice. my system didn't trigger a sell for any reason, which is fine. However, come into this week, the prick came back to about 40 percent profit only. Triggered a sell this week, but i almost feel like it should of closed last week. "dont be greedy" type mentality. It could be a better system i think.
If you've left all the backtest settings when using explore you may be getting last weeks buys and sells.
This is the likely culprit.
Change
SetTradeDelays( 1, 1, 1, 1 ); //Delays buys and sells to the next bar. Use for Backtesting only.
to
SetTradeDelays( 0, 0, 0, 0 );
When using Explore.
 
Traders always overcomplicate their trading
As humans, we have a tendency to overcomplicate everything we touch & it's no different when it comes to our trading. But (IMHO) trading doesn't need to be complicated but, we have a habit of complicating something that should be simple. Every trading strategy will have losing trades but if the strategy is profitable in the long run - what does it matter.

Simple trading ideas
Trading ideas need not be complicated as "simplicity" can win the day. I've had a look at some of my simpler strategies & found one to throw out there. Using Kaufman's Adaptive Moving Average (KAMA) for both signals (entry & exit) works rather effectively as a complete trading system. One handy indicator that's responsive to the trend & volatility.

The (KAMA) indicator can even be used as an Index Filter
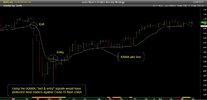
Kaufman's Adaptive Moving Average (KAMA) can also be used as an effective Index Filter (as displayed below). The white line is the (KAMA) plot.

Exit & Entry Signals
If the close is below the (KAMA) line "exit on the next bar". Similarly, If the open is above the (KAMA) line "enter on the next bar". I'm suggesting that you try it out, to experience how amazing this (KAMA) low lag indicator is. (KAMA) works on all periodicities with only minor parameter changes.

KAMA PLOT XAO Index Filter Capture.jpg

KAMA
Kaufman's Adaptive Moving Average (KAMA) is an intelligent moving average that was developed by Perry Kaufman. The powerful trend-following indicator is based on the Exponential Moving Average (EMA) & is responsive to both "trend & volatility". The (KAMA) can often be used in combination with other indicators & parameters.

Skate.
 
if you have a weekly system and want to exit within the week, a bit complicated
But otherwise just add an EXIT:
Sell=Sell OR C>=BuyPrice*2;
This is why I use the daily timeframe to trade my weekly—it’s very easy to do if using daily bars to trade weekly. It’s easy in AB to select the start and end of the trading week in AB
 
@qldfrog @silent1
Thanks for the input. I should have been clearer.
1. my system is a weekly system trades Monday open. No intraday trading
2. I don’t actually use the ApplyStop function In my ; from my understanding ApplyStop was implemented to mimic the brokers “stop” function and was never really intended to be used for explorer. I use a trailing loop at the moment.
3. My current system is working fine and working as it’s designed but I’m always looking for improvements. It was never designed to exit = or > %100 profit. It really was just a thought bubble that I wanted to test out so I quickly used the ApplyStop function as an initial test. “ what if” sort of thing. The thought bubble came about as I saw a winning position with 140 percent profit in the first week dwindle to 40 percent in the second week. Would I Have been better off closing it at the open of week2 and locking in the profit? That’s the hypothesis I’m testing.
4. @silent1 FYI even if you had trade delays set to 0 and equity (1) and you run explorer on the Sunday you actually won’t get any signals to enter for Monday’s open.I’ve tested this out before, hence the reason I went to a trailing loop. You only get signals at Monday’s close. You’ve given a deeper insight into it though so thank you. Always good to know.

I’ll try both your methods and see how it goes. I’ll let you guys know, I’ll put the results up in case anyone else has the same hypothesis.

I did some digging aswell and found this; not tested so not sure if it’ll work as intended


PcntProfit = 100 * ( h - ValueWhen( Buy, BuyPrice,1 ) )/ValueWhen( Buy, BuyPrice,1 );

profittaker= pcntprofit>=100;
Sell= Sell OR profittaker;

Thanks
OTA86
 
@othmana86 the way I handle additional exit conditions is to bundle them up & attach the additional exit condition to a looping trailing stop as a (Stale Stop). @Trav. is the man that can help you code your idea (if he has the time).

Ideas
If I don't test ideas, you will never know if they have an application?

Have a read here

Skate.
Thank you skate! I’m not a great coder so always great to get a hand. I’m going to try a few methods and see how it goes!
 
Thank you skate! I’m not a great coder so always great to get a hand. I’m going to try a few methods and see how it goes! - The thought bubble came about as I saw a winning position with 140 percent profit in the first week dwindle to 40 percent in the second week. Would I Have been better off closing it at the open of week2 and locking in the profit?

@othmana86, I've never had much joy using a "Take Profit Stop" as it seems to reduce the profitability. I have a "Take Profit Stop" coded into all my strategies (for evaluation) looking for an edge. I have the Take Profit Stop on a toggle so it can be "turned on" to evaluate the very scenario you highlighted. Whereas you're thinking in percentages, my preference is to use the Average True Range.

Add this to your strategy for evaluation
////////////////////////////////////////////////////////////////////////////////////
useTPStop = ParamToggle( "Use Take Profit Stop", "No|Yes", 0 );
MaxProfit = Param( "Take Profit ATR multiplier", 4, 1, 10, 1 );
////////////////////////////////////////////////////////////////////////////////////

Skate.
 
Strategy evaluation
I've been trading a strategy successfully for the last 18 months & I wondered if the strategy would trade the S&P 500 with similar success (the curiosity is killing me). Believing I had something special, the "Ducks Guts of strategies" I had the strategy recently evaluated.

Realisation
I was amazed to learn the strategy didn't produce the same results trading the (S&P500) as it did trading the (XAO). To tell you the truth, I couldn't believe the strategy performed so differently. For ease of understanding the evaluation report the strategy was a $100k portfolio (20 X $5k positions)

Evaluation remarks
"I ran your code against the current SP500 over the past 5 years and it appears not to trade very frequently? I then changed some of your price filters as the North American stock prices tend to be much higher than the Australian exchange prices. I still did not get many trades but a very high % of winners! CAGR 15.6% and MaxDD -35.7%"

Results
US SP500 MARKETS Untitled.jpg


How did it perform against the Russell 3000?
Well, "blow me down" - didn't the next report bring me down to earth.

Evaluation remarks
"I then tested against the Rusell 3000 a much larger universe of stocks, cagr 27.5% and MaxDD -51% - I am getting the feel for your approach, you want to buy-and-hold 20 stocks for a long period of time"

US Russel 3000 MARKETS Untitled.jpg


Summary
Apparently, it is a matter of "horses for courses". The realisation is slowly sinking in that not all "strategies" are universally adaptable to other markets (whereas the HYBRID Strategy when evaluated - performed well)

Skate.
 
Last edited:
Strategy evaluation
I've been trading a strategy successfully for the last 18 months & I wondered if the strategy would trade the S&P 500 with similar success (the curiosity is killing me). Believing I had something special, the "Ducks Guts of strategies" I had the strategy recently evaluated.

Realisation
I was amazed to learn the strategy didn't produce the same results trading the (S&P500) as it did trading the (XAO). To tell you the truth, I couldn't believe the strategy performed so differently. For ease of understanding the evaluation report the strategy was a $100k portfolio (20 X $5k positions)

Evaluation remarks
"I ran your code against the current SP500 over the past 5 years and it appears not to trade very frequently? I then changed some of your price filters as the North American stock prices tend to be much higher than the Australian exchange prices. I still did not get many trades but a very high % of winners! CAGR 15.6% and MaxDD -35.7%"

Results
View attachment 122386


How did it perform against the Russell 3000?
Well, "blow me down" - didn't the next report bring me down to earth.

Evaluation remarks
"I then tested against the Rusell 3000 a much larger universe of stocks, cagr 27.5% and MaxDD -51% - I am getting the feel for your approach, you want to buy-and-hold 20 stocks for a long period of time"

View attachment 122387


Summary
Apparently, it is a matter of "horses for courses". The realisation is slowly sinking in that not all "strategies" are universally adaptable to other markets (whereas the HYBRID Strategy when evaluated - performed well)

Skate.
What were the realm indexes return in the US during that period?
 
Been looking at the recent posts as have a bit of time.

The Bee strategy has impressed me, Skate.

I like the wide breadth of your strategies...the flexibility to conditions. Well done.
 
What were the realm indexes return in the US during that period?

@qldfrog I'm unsure of the term "realm indexes" but I can tell you that I have parked the strategy as of last Monday (even though it's been a terrific money earner).

The engine of the "Rush Strategy"
The weekly "Rush Strategy" marries an idea from Jim Berg & Guppy’s with a "twist" combining two strategies into one. (being subjected to filters & unique parameters of course) I use the “or” statement so the first signal from either is taken.

Signal generator
(a) Jim Berg's volatility-based trading system uses (ATR) volatility to identify a trade. How? - when the close is greater than Lowest Low Value (LLV) of the "Low" of the price bar of the last nPeriod "plus" 2 times the Average True Range of the last nPeriods. (I call this the JBRush)
(b) The other signal generation comes from the average of twelve "Multiple Moving Averages" by taking the average of the bottom 6 from the top 6 - then applying a smoothing factor to identify a trade. (I call this the GMMARush). Surprising both signals get into a trend very easily.
(c) I incorporate the negative (GMMARush) signal as another level to my Stale Stop.

Skate.
 
If you've left all the backtest settings when using explore you may be getting last weeks buys and sells.
This is the likely culprit.
Change
SetTradeDelays( 1, 1, 1, 1 ); //Delays buys and sells to the next bar. Use for Backtesting only.
to
SetTradeDelays( 0, 0, 0, 0 );
When using Explore.

I think Tomasz invented daylight savings too.

Eveytime i start thinking about tradedelays ( or daylightsavings) it confuses the hell out of me and i get it wrong.
 
Been looking at the recent posts as have a bit of time.

The Bee strategy has impressed me, Skate.

I like the wide breadth of your strategies...the flexibility to conditions. Well done.

The Bee Strategy was one of my original trading ideas
The Bee Strategy had been parked for quite some time as it rarely produced any signals. The "Bee Strategy" is a trading strategy concentrating on the ASX20. I was never that keen on trading "large caps". The parameters of the "Bee Strategy" are unforgiving having more than a handful of stringent buying conditions. Trading the (ASX20 Index) the signals are always few & far between.

The COVID flash crash
The "Bee Strategy" was resurrected at the time of the massive sell-off of good companies during the Covid crash. Believing I could capitalise on an opportunity of the (panic) sell-off - I ran the strategy every day during that period.

On the 19th of March 2020
The "Bee Strategy" started to produce signals on the 19th of March 2020. The strategy evaluation was conducted when I was a "beta tester" for Norgate Data having the full suite of products available to me at that time, including 20 years of historical data. Knowing how the strategy performed - the rest is now history.

By-the-way
I rarely trade large-caps, because of the low volatility "but the Covid period" produced volatility in spades. While I saw a buying opportunity of a lifetime, others saw the meltdown of the markets as we knew it.

Skate.
 
What were the realm indexes return in the US during that period?
Was just wondering how much the exploration domain sp500, russel300 plus dividends would have compared along the same period.was it better or not.i do that type of check here on the asx : xnt etc but not familiar with US equivalent.
In a nutshell did it beat the matching index?
 
Was just wondering how much the exploration domain sp500, russel300 plus dividends would have compared along the same period.was it better or not.i do that type of check here on the asx : xnt etc but not familiar with US equivalent.
In a nutshell did it beat the matching index?
@qldfrog the "Rush Strategy" was extremely profitable trading the US markets but didn't perform as designed or expected. The holding period dramatically increased with a drawdown that most couldn't stomach. As far as beating an Index, any good strategy worth its salt (IMHO) does - otherwise, there is no edge.

Beating an index
@peter2 perfectly demonstrates how his trading methodology "beats the index" as his trading edge is derived from (discretionally) nailing the exit.

Skate.
 
Long weekend viewing (4 of 4)
If you found the first three videos informative, the third video in this series will be just as captivating. In the last tutorial, Martyn shed light on where the edge sits on the probability spectrum, & what needs to be done to identify trading strategies that have it.

You need an Edge
The most basic thing you need to be a successful (profitable) trader is an edge, an advantage in your trading that produces a positive net profit over the long-term. This edge is the culmination of all your research, planning, execution, & state of mind while managing your portfolio. The more you read & (watch), the more you will become interested in trading. We have all made dumb mistakes when starting out, that is just being a beginner.

4. The Probability Distribution of your Trading Edge


To be a successful trader
Trading is a marathon, not a sprint. If you are new to trading, please make an effort to read my ‘Dump it here’ thread from the very first post as it may save you many years of self-education. It's a big ask, but if you have the slightest interest in learning to trade (profitably) it may be just worth the effort. (at least grab a copy of my free eBook https://www.aussiestockforums.com/posts/1014728/)

Skate

Hi Skate,
Now that my time at the beach has come to an end I thought I watch these videos you've posted. I have to say these are great videos and do a very good job of explaining the importance of monte carlo testing and sample size. Anyone starting out in system trading would do very well to watch these video to understand the importance of this often ignored aspect of system analysis.
MA


What becomes very clear, quite quickly, is that many systems traders do not have and/or do not understand what is an 'edge'.

jog on
duc
 
Strategy Rotation
With a suite of strategies, I've found strategy rotation to be a very "beneficial tool" when it comes to my trading. But the big question is when do you rotate from one strategy to another?

Without giving too many secrets away
A simple measure (as a rule of thumb) is the ratio of "buy signals" versus "sell signals". It's not the number of signals but the ratio between the two. This is not how I decide to rotate out of one strategy into another but it's a "quick & dirty" explanation.

The HappyCat Strategy
Trading this strategy in a trending market never fails to generate good returns. But in late 2020 "red flags started to appear", as the ratio of signals got out of whack. It's a fair indication that a strategy substitution was in order (similar to replacing an NRL player). Sometimes substituting a player "just at the right time" can have a positive impact on the game. Strategy rotation can have a similar effect on your trading performance.

The "HappyCat Strategy" versus the "ConnorsRSI Strategy"
I've made plenty of posts espousing the benefits of the "HappyCat Strategy" while at the same time remarking that the "HappyCat Strategy" will struggle in non-trending market.

The "ConnorsRSI Strategy"
My Trusty old "ConnorsRSI Strategy" is likened to an NRL forward, "trusty & dependable" & gets the job done (but lacks the speed in a roaring bull market).

A short Backtest period (3-months)
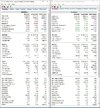
An example why a "strategy rotation" was required is displayed in the backtest results below. The direct comparison (shoot-out) between the "HappyCat Strategy" & the "ConnorsRSI Strategy" shows why the strategy rotation had to occur.

The backtest period
The backtest is from 1st January 2021 to end-of-close Thursday 1st April 2021 - perfectly displaying why the rotation of strategies can be beneficial. Don't get me wrong, the "HappyCat Strategy" is worth its weight in gold (in a bull market)

CRSI v HappyCat Capture.JPG

Skate.
 
Last edited:
A simple explanation
Put 4 traders in a room together & they will all have their reason why they "enter & exit" a position. Put 4 system traders in another room & their reasoning behind why they enter a trade can be just as dramatic & diverse.

Signal comparisons
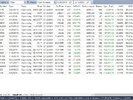
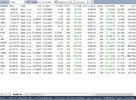
I've just posted a simple comparison of "results" achieved over a short period from two of my trading strategies. It's only responsible for me to post the signals from two recent trades.

HC v ConnorRSI Capture.JPG
Skate.
 
Top