Australian (ASX) Stock Market Forum

Dump it Here

It's not easy
Profiting from the stock market is exceedingly difficult to do consistently over a long period of time because the market is irrational and emotional. It moves in a manner that has little appreciation for what we might think is reasonable.

Taking control
Trading is about taking control, it's about being active & not passive. Our aim is to identify opportunities by anticipating a move in a direction we can take advantage of. If we are right stay & catch a good trend - it pays to stay on the ride as long as we can till the momentum slows or changes direction - maximising profit. If you exit a position too early or use a "take profit stop" in your strategy - you'll forego the right to the rewards for the risk you have taken.

I'll leave the last word to @peter2
"It's all to easy to post when things are going well and stroke our own egos. When regular posters go quiet, we know they're having a bad run. I post when I'm frustrated and that helps me understand why. I post when my selections are "out of sync" with what's moving in the market because it helps me see what I need to correct. I post about the big losers because they're the trades that provide us with lessons to learn. They reinforce things I already know, but I hope others take note as well".

Skate.
 
Understanding the markets
As we know all too well, any bad news in a jittery market will make traders rush into panic mode, causing huge selloffs only to find a buying opportunity the very next day. The markets are constantly doing things you don’t expect, it's the very reason to keep your emotions & frustration in check. Checking your emotions whilst trading allows you the peace of mind to hold good positions without panic selling with the heard.

Perceptions
Traders need to understand that markets are based on human behaviour & our "perception" creates value at any given moment. While the differences in our perceptions can be subtle, they do alert us when the markets are not performing as they should. As we have seen during the past several weeks, the markets are not based on fundamentals. The markets are a reflection of the overall belief system of all the traders in the market at any given time. Charts reflect the markets as explained by @over9k in his chart reading thread. I'm a firm believer in using "indicators" to indicate where the market is likely to be heading - then trying to capitalise on that movement.

Skate.
 
System trading
Often people think about all the technical information available but "fail to appreciate" one of the most important aspects of becoming a successful trader - "personality traits".

Grasping new information
Personality has a lot to do with new traders’ ability to grasp & properly execute new trading information. What seems natural to many long-term traders seems alien to a beginner. Those members who make educational posts try to explain what makes a stock move, then go on to explain why.

Slow down the learning
New traders who don’t expect too much too soon, those who understand learning the business of trading takes time, money, & experience tend to survive in this game.

Being compulsive
Many new traders make the mistake of bringing a gambling mindset to trading. However, this mindset can wipe out your trading account quick smart. If you are serious about trading, then changing this mindset is vital. You must never forget that the objective of trading is making a profit. Not only does that mean learning a winning trading methodology, but it also requires careful risk assessment, disciplined money management, emotional & behavioural discipline, with the ability to execute a trading plan flawlessly, as if they were an art form.

In a nutshell
Trading is predicting the value of a security sometime in the future.

Skate.
 
Keywords
I've just been reminded by a "private message" that some of my ideas have made a difference. The (GTFO) exit has saved my bacon "big time" on two occasions so far. The (GTFO) is a worthy tool in my trading toolbox. After reading the "pm" I thought I would take a short break & make a post. (carrying on with the "theme" of trading in tough times)

Trading in an uptrend
As traders, we have all experienced the joy of trading in an uptrend. Trend trading seemed to work well when the markets are trending up, but not so good in a downtrend. Trading during a prolonged downtrend has the ability to play with your emotions allowing frustration to set in.

A good strategy takes time to develop
Those new to trading are very concerned about finding a strategy that works quickly while at the same time quickly dismiss a good strategy that refuses to display early gains. When I post the weekly trading results of the "Sphere Strategy" please keep this in mind.

The perfect entry
As traders, we all want to hit the entry as close to the turning point of a trend as possible but it’s near impossible to achieve. A few simple trend indicators are all you need to enter a trade. Entries during an uptrend is a no-brainer - it's like a comparison of a monkey throwing dart achieves the same or better result.

Exits
When it comes to the exit - there is no such thing as the perfect one. Exits need to work with your risk level (tolerance) & style of trading. Also, I would like to say having a (GTFO) compliments all exits strategies. When developing a strategy (IMHO) don't try to maximize everything. (Don't even try). Sometimes "Good enough is Good enough".

Skate.
 
When developing a strategy (IMHO) don't try to maximize everything. (Don't even try). Sometimes "Good enough is Good enough".

I think this is the mistake a lot of system traders make--they try to maximize things particularly with a singular focus on profit/CAGR. Sure profit is important (after all that is why we trade), but for me it is all about reliability and predictability of consistent future returns. In other words, does my system generate a profit across a range of different out of sample data. I'd much rather live trade a system that returns 10-15% CAGR consistently across a broad range of out of sample data than a system that generates a 45% CAGR with unknown certainty across out of sample data. In my experience, high tuned and maximized system tend to be very unreliable and unpredictable on out of sample data and those with a more "good enough" approach tend to be more predictable across out of sample data.
 
Like a lot of folks that follow this thread I live trade a weekly system. At the end of each calendar quarter I usually make a review of the trades I've done during the past quarter and do a general review of my systems' performance. Given we are about a year on since the Covid crash I was just reviewing how my systems have recovered since then. I thought it might be worthwhile doing a dump of how my live weekly system as performed over the past 12 or so months. The chart below tracks the unit value of my live weekly system. In summary my system was 100% cash through to about mid May 2020 and since then it has gone from a unit value of approx. 1.4 through to close today of approx. 2.10. This equates to a gain of approx. 50%. The covid crash saw the system encounter a rough DD of around 10% so over all my system as put on around 40% of the unit price going into the covid crash.

As you can see there has been some notable declines in the unit price (end of Jan this year through to around end of Feb) but overall it remains in a good up trend since the system "switched back on" in mid May of last year.

current performance.JPG
 
Like a lot of folks that follow this thread I live trade a weekly system. At the end of each calendar quarter I usually make a review of the trades I've done during the past quarter and do a general review of my systems' performance. Given we are about a year on since the Covid crash I was just reviewing how my systems have recovered since then. I thought it might be worthwhile doing a dump of how my live weekly system as performed over the past 12 or so months. The chart below tracks the unit value of my live weekly system. In summary my system was 100% cash through to about mid May 2020 and since then it has gone from a unit value of approx. 1.4 through to close today of approx. 2.10. This equates to a gain of approx. 50%. The covid crash saw the system encounter a rough DD of around 10% so over all my system as put on around 40% of the unit price going into the covid crash.

As you can see there has been some notable declines in the unit price (end of Jan this year through to around end of Feb) but overall it remains in a good up trend since the system "switched back on" in mid May of last year.

View attachment 122242
Thanks a lot, I find such graph quite useful comparing my systems performances etc: obviously nowhere as successfull for me :)
 
Like a lot of folks that follow this thread I live trade a weekly system. At the end of each calendar quarter I usually make a review of the trades I've done during the past quarter and do a general review of my systems' performance. Given we are about a year on since the Covid crash I was just reviewing how my systems have recovered since then. I thought it might be worthwhile doing a dump of how my live weekly system as performed over the past 12 or so months. The chart below tracks the unit value of my live weekly system. In summary my system was 100% cash through to about mid May 2020 and since then it has gone from a unit value of approx. 1.4 through to close today of approx. 2.10. This equates to a gain of approx. 50%. The covid crash saw the system encounter a rough DD of around 10% so over all my system as put on around 40% of the unit price going into the covid crash.

As you can see there has been some notable declines in the unit price (end of Jan this year through to around end of Feb) but overall it remains in a good up trend since the system "switched back on" in mid May of last year.

View attachment 122242
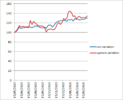
1617262544698.png along similar period my daily system: broadly similar in shape but my system gave up all gains in the january drought whereas yours kept cruising.hopefully the slight tweaks along the months have improved futures performance.Hope it helps
 
Hi guys, I have a question about placing of orders and their execution.
I am almost fully invested (almost no free money) and need to update portfolio/rebalance. I place my (limit) orders before market opening hours. First of all I placed sell orders, but when placing buy orders I get error saying that I have not enough money on my account. Of course I don't, but money will be there after execution of selling orders. I cannot bypass this error.
Is this normal behaviour or I just have crappy broker?
My question may be basic, but I have very little experience with this.
Thanks!
Normal behaviour with my broker: bell direct, it is an issue
With commsec (CBA), you can do it without problem as they just expect for you to have the money on settlement day
 
Normal behaviour with my broker: bell direct, it is an issue
With comsec (CBA), you can do it without problem as they just expect for you to have the money on settlement day
I am trading US market, so cannot go through commsec. Thinking to switch to Interactive Brokers, but I don't know whether it will help.
 
If you can get a small margin facility you can use it to temporary cover the buys without increasing risk by much.

Just don't be tempted to actually go over your cash balance to leverage as it may amplify your wins but it also brings you closer to zero.
 
Like a lot of folks that follow this thread I live trade a weekly system. At the end of each calendar quarter I usually make a review of the trades I've done during the past quarter and do a general review of my systems' performance. Given we are about a year on since the Covid crash I was just reviewing how my systems have recovered since then. I thought it might be worthwhile doing a dump of how my live weekly system as performed over the past 12 or so months. The chart below tracks the unit value of my live weekly system. In summary my system was 100% cash through to about mid May 2020 and since then it has gone from a unit value of approx. 1.4 through to close today of approx. 2.10. This equates to a gain of approx. 50%. The covid crash saw the system encounter a rough DD of around 10% so over all my system as put on around 40% of the unit price going into the covid crash.

As you can see there has been some notable declines in the unit price (end of Jan this year through to around end of Feb) but overall it remains in a good up trend since the system "switched back on" in mid May of last year.

View attachment 122242
View attachment 122243 along similar period my daily system: broadly similar in shape but my system gave up all gains in the january drought whereas yours kept cruising.hopefully the slight tweaks along the months have improved futures performance.Hope it helps

Trading is a solitary endeavour
Without members posting graphical information about their actual trades or trading results it's hard to benchmark your own trading performance. We tend to trade in our own little bubble & at times (if you are like me) wonder if my trading results mirror the trading results of others. Basically, comparing my equity curve to others allows me to gauge if my results are in the normal range (if there is such a thing).

Posting equity curves
By sharing information, it allows a small glimpse of how others handle trading by displaying their actual results. Admittedly the trading results will vary but that's not the point. Looking at equity curves is an affirmation (a process) if your personal trading is within the ballpark of others.

Skate.
 
Year in review
As @MovingAverage posted his equity curve from April 2020 to the present (which looks amazing by the way) & @qldfrog from May 2020 to the present has motivated me to post my equity cure.

Disclaimer
The equity curve in the next post is my combined equity curve. The equity curve is a combination of 9 strategies that I trade (an equity curve average) rather than posting individual results for the last Calendar & Financial year. Because of the Covid-19 flash crash, skewing the equity curves & results I've included both the Calendar & Financial year.

The Covid flash crash affected my trading in more ways than one
Pain tends to focus me & the financial pain resulting from the Covid crash was excruciating - even though it's not that evident by the 2020 equity curve.

Backtesting means JACK
Without getting into another exchange, I want to re-stated that (IMHO), Amibroker backtest results mean "Jack" & hold little interest in assessing the true performance of a strategy. I'm first to admit that they do give an indication if the methodology behind the strategy being backtested is sound or not.

Actual trading results
Results from live trading are the "true measure" of your trading strategy as it confirms if your "trading plan" is solid.

Skate.
 
Equity Curve
The graphics below are an equity curve from a combination of 9 trading strategies (being my trading average)

Trading results
First off, I should point out that that the graph starts off halfway between the 2019/2020 financial year. Going into the 2020 Calendar year I was in substantial profit. (The reason the equity curve doesn't start at zero)

3 Equity curves (incorporates the COVID-19 Flash Crash)
The graphic below represents the 2020 calendar equity curve that incorporates the COVID trading period. The 3-equity curves are for the same period displayed as Year/Month/Week format. The year curve quickly indicates my trading results where the other two represent the roller coaster ride to get there.

(1) The 2020 Calendar year (Yearly - Equity Curve)

1. YEARLY Snap Shot in time Monthly - Calendar 2020 - BY YEAR - Capture.jpg

(2) The 2020 Calendar year (Monthly - Equity Curve)

2. MONTHLY Snap Shot in time Monthly - Calendar 2020 - BY MONTHS - Capture.jpg


(3) The 2020 Calendar year (Weekly - Equity Curve)

3. Weekly Snap Shot in time WEEKLY - Calendar 2020 - BY MONTHS - Capture.jpg


Skate.
 
My 2020/2021 Equity Curve
The graphics below (the equity curve) is the average from trading 9 strategies. The previous equity curve posted was for the 2020 Calendar year - that included the Covid-19 trading period.

The 2020/2021 Financial year equity curve
Posting the equity curve for 2021 (the Covid trading period is excluded). I should note that the 2020/2021 financial year kicked off in profit. (it's the same reason the graph doesn't start at zero)

(1) The 2020/2021 Financial year (Yearly - Equity Curve)

4. YEARLY Snap Shot in time Monthly - FINANCIL 2020 - BY YEAR - Capture.jpg


(2) The 2020/2021 Financial year (Monthly - Equity Curve)

5. MONTHLY Snap Shot in time Monthly - FINANCIL 2020 - BY MONTH - Capture.jpg


(3) The 2020/2021 Financial year (Weekly - Equity Curve)

6. WEEKLY Snap Shot in time Monthly - FINANCIL 2020 - BY Week - Capture.jpg


Skate.
 
Brains

Brains are an overrated attribute when it comes to trading. Smart people tend to think logically and have a hard time dealing with a market that ignores what should be painfully obvious. The market is very emotional and illogical at times, and if you are too analytical, you will be surprised often. Using logic to argue with a lunatic is useless, and using logic to figure what the market might do on any given day is equally useless.

Skate.

Brains
I've posted that brains are overrated when it comes to trading but after listening to Mark trying to win a Harley Davidson, I might have to rethink that post.

Brains (Update)
I have to say - you do need a certain level of grey matter to play this game.

Listen to the YouTube
It will be the funniest 3 minutes you will ever hear & I can guarantee - you will never forget Mark from Greenacre. I like cheering for the underdogs - but in this case, I'm hoping Mark didn't win the Harley.

Background
About ten years ago, a radio station in Sydney (Triple M) had a contest in which callers could qualify to win a Harley-Davidson motorcycle. I've owned a few Harleys & it was a nice prize. So, caller #ten rings in, his name is Mark, and he’s from Greenacre, a few miles southwest of Sydney & for being caller #10, Mark can qualify to win the motorcycle. The question was to spell the name of a musical band. All Mark had to do (to go into the competition) was to spell the name of the Band’s ACDC. Yep. He just has to spell AC/DC.

Can Mark do it?


* Brains are not overrated.

Skate.
 
Drilling down - (The Daily equity curve)
Drilling down a yearly equity curve to a weekly than onto a daily (equity curve) go some way in displaying how the volatility of returns can play with your emotions.

Portfolio
Displaying the same equity curve & drilling down to a lower time frame goes some way in displaying the volatility of the securities in your portfolio.

Drill down period (Yearly periodicity)
The drill-down period is from 15th February 2021 to 1st April 2021 (totalling 34 days or about a month) The monthly equity curve belies the true volatility of trading.

Daily drilldown period YEARLY Snap Shot in time Monthly - FINANCIL 2020 - BY YEAR - Capture.jpg


The same drill-down period (Weekly periodicity)
Using a weekly view, the weekly volatility starts to display.

2222. Weekly  drilldown period WEEKLY Snap Shot in time Monthly - FINANCIL 2020 - BY Week - Ca...jpg


The same drill-down period (Daily periodicity)
Using a daily view, the daily volatility is clearly displayed. The jaggedness of the daily returns drives your emotions that can invoke a feeling of frustration. Viewing your returns over a longer time frame smooths the equity curve & your emotions - this was the point @qldfrog made in a recent post in his thread.

3333.daily Capture.jpg

Skate.
 
Drilling down - (The Daily equity curve)
Drilling down a yearly equity curve to a weekly than onto a daily (equity curve) go some way in displaying how the volatility of returns can play with your emotions.

Portfolio
Displaying the same equity curve & drilling down to a lower time frame goes some way in displaying the volatility of the securities in your portfolio.

Drill down period (Yearly periodicity)
The drill-down period is from 15th February 2021 to 1st April 2021 (totalling 34 days or about a month) The monthly equity curve belies the true volatility of trading.

View attachment 122291


The same drill-down period (Weekly periodicity)
Using a weekly view, the weekly volatility starts to display.

View attachment 122293


The same drill-down period (Daily periodicity)
Using a daily view, the daily volatility is clearly displayed. The jaggedness of the daily returns drives your emotions that can invoke a feeling of frustration. Viewing your returns over a longer time frame smooths the equity curve & your emotions - this was the point @qldfrog made in a recent post in his thread.

View attachment 122294

Skate.
Thanks for sharing Skate. You’re weekly chart looks impressive as it doesn’t have any significant drawdown—I think this is the result of trading a bunch of different strategies, which I assume are reasonably uncorrelated. I’ll post up my equivalent for my three different systems.
 
Thanks for sharing Skate. You’re weekly chart looks impressive as it doesn’t have any significant drawdown—I think this is the result of trading a bunch of different strategies, which I assume are reasonably uncorrelated. I’ll post up my equivalent for my three different systems.

A better description
Trading a range of “strategies” smooths the consistency of returns.

Skate,
 
Top