Australian (ASX) Stock Market Forum

Dump it Here

Note : I DO NOT expect to make a 2M profit on 100k in 5 years.

Backtesting means JACK
@qldfrog, well stated - without getting into another exchange, I want to re-stated that (IMHO), Amibroker backtest results mean "Jack" & hold little interest in assessing the true performance of a strategy. Live trading is the "true measure" as it confirms if your "trading plan" is solid.

Skate
 
A little more about indicators
I want to make a disclaimer - I'm a big fan of both Perry Kaufman & John Ehlers incorporating many of their ideas into my trading strategies. First, I'll post about John Ehlers (DSMA) indicator https://www.aussiestockforums.com/threads/dump-it-here.34425/post-1101319 & in the next post I'll discuss Kaufman's Adaptive Moving Average (KAMA)

My best strategy going into 2020 was my "Weekly PANDA Strategy"
I've made many posts about my best strategy "The Panda Strategy" it was a consistent performer that wasn't too shabby. When the strategy was stress-tested with the recent COVID-19 panic selling, the exit was slow to react. The exit strategy fell well short of my expectations. Recently I converted the strategy from Weekly to Daily & reported the trading results live.

DSMA Hyperlinks below

What's so special about the DSMA?
The DSMA is a data smoothing technique that acts as an exponential moving average (EMA) with a dynamic smoothing coefficient. The smoothing coefficient is automatically updated based on the magnitude of price changes. The resulting DSMA indicator provides substantial smoothing of the data even when price changes are small while quickly adapting to these changes, a win/win scenario.

Trade with caution
If you research the DSMA indicator, just be careful as John Ehlers's idea has been "mongrelised" beyond belief, getting the coding & parameter for the entry can be a challenge but rewarding.

Skate
 
A little more about indicators
Kaufman's Adaptive Moving Average (KAMA). The (KAMA) indicator I posted about recently is a handy indicator because of its unique characteristic of indicating the market trend & volatility. As traders, we all “make a decision” on the basis that future trends will continue to develop in the same direction as the past trends.

DSMA & KAMA indicators

Like all moving averages, the KAMA & DSMA indicators shine head & shoulders over all the others (IMHO) & can even be used for support & resistance levels.

The KAMA indicator does a good job of filtering out market noise
When market volatility is low, Kaufman’s Adaptive Moving Average remains near the current market price, but when volatility increases, it will lag behind. What the KAMA indicator aims to do is filter out “market noise” of temporary surges in price. One of the primary weaknesses of traditional moving averages is that when used for trading signals, they tend to generate many false signals. The KAMA indicator seeks to lessen this by generating fewer false signals "by not responding" to short-term, insignificant price movements.

Skate.
 
That is what you want: you want to expose the greatest number possible to your edge.

jog on
duc
If by greatest number you mean active open positions then that proposition is just out and out wrong. There are so many system factors that you need to take into account before making that statement. For example, a system with a low % of winners will, in general, NOT benefit from a large number of open positions, but a system with a higher % of winners may well benefit from having exposure to a larger number of open positions. Unless you really understand several key properties of your system you cannot make blanket statements like that.
 
Kaufman's Adaptive Moving Average (KAMA) is worthy of a few posts
The (KAMA) indicator can be used to identify existing trends, & impending trend changes. Knowing when a trend is changing allows you to take advantage of the reversal points to enter or exit a position.

How do we use the KAMA indicator?
Basically, the uses of this indicator are "unlimited" or limited by your imagination & research. A simple way to use the KAMA is to plot it & look at a few charts to get a feel for how predictive the KAMA indicator can be. When the KAMA indicator line is moving lower, it indicates the existence of a downtrend & when it’s moving higher, it shows an uptrend. Compared to the Simple Moving Average, the KAMA indicator is less likely to generate false signals that may cause a trader to incur losses. It pays to remember that the KAMA is an adaptable indicator.

More to follow.

Skate.
 
Backtesting means JACK
@qldfrog, well stated - without getting into another exchange, I want to re-stated that (IMHO), Amibroker backtest results mean "Jack" & hold little interest in assessing the true performance of a strategy. Live trading is the "true measure" as it confirms if your "trading plan" is solid.

Skate
I often think about this statement @Skate and while I think there is a great deal of merit in it I prefer to think that backtesting (the way I do it) is only a means for giving me a level of confidence that my systems have a good chance of making a profit in the future, but there is absolutely no way I will look at backtesting results and say over the next X period of time I should expect a CAGR of Y%...to do so is naïve at best.
 
Alternative uses for the KAMA indicator
The KAMA indicator can be used in a few different ways. One way is (as I posted before, "how I take advantage of the KAMA indicator") or alternatively, code two sets of KAMA parameters & use the cross of them to trigger signals. For example, when the faster KAMA line crosses above the slower KAMA line, this indicates a change from a downtrend to an uptrend. The KAMA signals are faster than both (SMA or EMA).

The KAMA indicator can easily be applied to a chart
One of the uses of Kaufman’s Adaptive Moving Average is to identify the general trend of current market price action by viewing a price chart. Basically, when the KAMA indicator line is moving lower, it indicates the existence of a downtrend. On the other hand, when the KAMA line is moving higher, it shows an uptrend. As compared to the Simple Moving Average, the KAMA indicator is less likely to generate false signals that may cause a trader to incur losses.

Skate.
 
A must watch Video
To round off my series of posts - I've found a short YouTube video where Martyn Tinsley explains the differences between a range of moving averages (SMA, EMA, KAMA) - it's well worth watching even if you are a seasoned trader.


Skate.
 
If by greatest number you mean active open positions then that proposition is just out and out wrong. There are so many system factors that you need to take into account before making that statement. For example, a system with a low % of winners will, in general, NOT benefit from a large number of open positions, but a system with a higher % of winners may well benefit from having exposure to a larger number of open positions. Unless you really understand several key properties of your system you cannot make blanket statements like that.

I'm thinking
This post will make for an exciting educational exchange. @ducati916 responded to a previous post in "general, concise terms". I'm sure the Duc will respond with an expanded explanation.

Skate.
 
@Skate Thank-you.

@qldfrog , regarding your post with the MC results of the 11pos vs 40 pos.

The completely different equity curves indicate to me that there is a significant error in your system code. It will most likely be in the position sizing code (# trades, # shares).
Other aspects that may influence your observation that 11 pos is better than 20+ positions.
- position score,
- market cap, sector preferencing
- influence of an index filter (small caps don't move the index)

I agree with @MovingAverage 's suggestion of using equal size positions throughout the testing period.

Pos size compounding will make the later results influence the P&L more than the early results.
Thanks @peter2 and @MovingAverage , I will follow MA suggestions to try to debug this , I feel better not being alone thinking something is not right.So counter intuitive.Will keep you posted
 
I'm thinking
This post will make for an exciting educational exchange. @ducati916 responded to a previous post in "general, concise terms". I'm sure the Duc will respond with an expanded explanation.

Skate.
You may wish to put both of us on ignore while we debate this issue ?
 
You may wish to put both of us on ignore while we debate this issue ?
Debating the merits of an alternative view is how we learn
I'm sure @ducati916 (if has the time or desire) will expand on his original post. Readers who have an open mind will take something from both sides, I'm sure of that.

I apologise for the two-way ignore
I didn't think I would get any flack for putting a few members on ignore for a week - why? because I believed my posts wouldn't hold any value to them being a thread for beginners.

Also
I would like to say that "I wouldn't intentionally do anything to undermine the friendly atmosphere of this thread"

In my defence
I was spending the majority of my days reading posts. Using the ignore feature was a circuit breaker (for me), that's all.

If it's any consolation
Those members on ignore were the ones I was addicted to reading.

Skate.
 
@Skate Thank-you.

@qldfrog , regarding your post with the MC results of the 11pos vs 40 pos.

The completely different equity curves indicate to me that there is a significant error in your system code. It will most likely be in the position sizing code (# trades, # shares).
Other aspects that may influence your observation that 11 pos is better than 20+ positions.
- position score,
- market cap, sector preferencing
- influence of an index filter (small caps don't move the index)

I agree with @MovingAverage 's suggestion of using equal size positions throughout the testing period.

Pos size compounding will make the later results influence the P&L more than the early results.
just checked the code : pretty simple and I believe right:
SetPositionSize( 100 / maxOpenPositions, spsPercentOfEquity ); // Fixed Fractional Sizing
with maxOpenPositions :11, 20 or 40 for my previous tests
I move to
SetPositionSize( 5000, spsValue ); It will obviously change the results but do we still see the degradation of results?
using AB optimise to run with a nb of positions between 10 and 50;

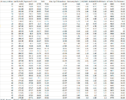
The results are a bit big for display:still 01/01/2016 to today
1617712542486.png
but basically :
we do not see a degradation anymore.As expected the exposure increases with the number of positions
and the DD as well.
% winners is constant.
with only $100k to cut into 5k parcels, we obviously need to get some serious profit before being able to get the 50 positions
The sweet spot seems between 25 and 29 positions: 210% net profit, around 50% exposure and drawdown below 20%
other test periods vary slightly with 19 to 22 for some older test periods
obviously sticking to limited number of 5k parcels even after massive wins is not realistic.
Why would you not reinvest your gains?
if we have unlimited fund(to be able to take the 50x5k parcels) from start which is probably the best way to check the optimal nb of positions, i get a sweet spot of :drumroll surprise: 20; maybe due to previous optimisation? but that tend to indicate that my best returns should be with that number of positions.
Once profit comes, wemight want to increase the number of parcels:
i did this with one of my system starting at 16 positions and increasing toward twenty
And there is the issue of Risk Management.how much of your capital in a singlestock.
Anyway, I hope this little experience helps
 
@qldfrog Thanks for the extra work. I hope you got something from it.

I don't use AB and those results require lots more explanation before I could make any clear decisions about the trading system and the optimum number of positions for that system.

The only value in that chart that tells me anything about the system is the W% which is remarkably constant during the increasing number of trades (34%). In order for this system to be profitable the AW/AL must be >2. To get an edge (expectancy) that I'd be comfortable with, the AW/AL would have to be >2.8. Include brokerage and some slippage the AW/AL would have to be >3.

----------------------------------

I totally agree with @ducati916 last two posts (low numbers, edge). Like him, I'm going to jog on and maybe add to my open VIAC position.
 
If by greatest number you mean active open positions then that proposition is just out and out wrong. There are so many system factors that you need to take into account before making that statement. For example, a system with a low % of winners will, in general, NOT benefit from a large number of open positions, but a system with a higher % of winners may well benefit from having exposure to a larger number of open positions. Unless you really understand several key properties of your system you cannot make blanket statements like that.

To address this, we will have to start with an assumption.

Which is: that the system in question (A) does possess an edge; and
That a random system (B) (no edge) is compared against it.

If the system, A, that has a true edge is exposed to a low number of trades, the results could be (a) better than B, (b) worse than B, (c) equivalent to B.

The higher the number of trades taken, then the more system A will start to demonstrate its edge as compared to B.

So back to QF's issue:

We have talked here and else where a lot about the number of positions in a system
I usually target 20 or so for risk management purpose.
Played a bit yesterday with backtesting this number of max positions and in my systems at least, daily and weekly:
I consistently got much better results with lower max number of positions.
For MA : along 2000+ trades so definitively consistent and statistically relevant

The 'thing' with small sample sizes is that there is greater variability in small sample sizes.

If you therefore have a system that (assuming a true edge) throws up 50 trades: you have to take all 50. You cannot take 20 and expect your results, over time, to replicate your edge.

If you do only take 20, then again, it is a small sample size and your results, due to pure chance, will be far higher both in profit and drawdown due to this increased variability.


Now of course none of this applies if the system in question does not have a true edge.

Glaringly absent on this thread is anyone building a system, actually stating what their edge is, in simple and concise terms. Now this may rightly be due to paranoia, that too many traders trying to trade the same edge will dissipate that edge, ie. the statistic that is watched loses its power to inform. This then raises the issue of longevity of systems: how robust is your edge? Is the system past its sell-by date?

Other types of edge are profitable: for eg. I am extremely disciplined, I can take my losses/profits clean. That sort of edge is in the domain of discretionary traders, as tech/a was trying to illustrate. Yes systems traders can code in SL that execute automatically, but, there are issues, too numerous to go into here.

However, the edge that everyone seeks is a market edge. I will give you 1 for free: Volatility cones. That is a market edge that has stood the test of time, well over 100yrs now. I can give it to you free because it is an intrinsic edge to the market and cannot be squashed. Can it be coded? I have no idea. I'm not a systems trader. However, that is a true edge.

What is also clear from this thread is that many systems consider an edge to be 'markets trend'. And it is. The thing about this edge is the timeframe. The timeframe is a critical component, as is the choice of market. So long trending markets: Bonds, Currencies and with the current QE, stocks (which have gone up since year dot, with a few bad breaks). Reversion to mean markets are Commodities and Currencies.

Anyway, far too long a post.


jog on
duc
 
@qldfrog Thanks for the extra work. I hope you got something from it.

I don't use AB and those results require lots more explanation before I could make any clear decisions about the trading system and the optimum number of positions for that system.

The only value in that chart that tells me anything about the system is the W% which is remarkably constant during the increasing number of trades (34%). In order for this system to be profitable the AW/AL must be >2. To get an edge (expectancy) that I'd be comfortable with, the AW/AL would have to be >2.8. Include brokerage and some slippage the AW/AL would have to be >3.

----------------------------------

I totally agree with @ducati916 last two posts (low numbers, edge). Like him, I'm going to jog on and maybe add to my open VIAC position.
Thanks for stating the so obvious which often stares in my face, yet get ignored.
That's why it is good to have this forum and put pen to paper: when with blurry head well past bedtime. with a 33% or so win rate,i indeed need twice the AW to AL to break evenand that should be one of the key column indeed.
Posted before reading mr ducati's post so more an answer to Peter.
 
To address this, we will have to start with an assumption.

Which is: that the system in question (A) does possess an edge; and
That a random system (B) (no edge) is compared against it.

If the system, A, that has a true edge is exposed to a low number of trades, the results could be (a) better than B, (b) worse than B, (c) equivalent to B.

The higher the number of trades taken, then the more system A will start to demonstrate its edge as compared to B.

I'm sure it is just my pea brain not comprehending what you are saying, but if by "higher number of trades taken" you mean with reference to the total number of trades taken over a certain period of time (e.g., 5, 10, 20 plus) years then I completely agree with what you say. But if this is simply about saying: if your system has an edge then moving from say a max of 10 simultaneous open positions to a max of 20 simultaneous open positions then I don't agree with that. But I think you are referring to the former and not the latter?
 
I'm sure it is just my pea brain not comprehending what you are saying, but if by "higher number of trades taken" you mean with reference to the total number of trades taken over a certain period of time (e.g., 5, 10, 20 plus) years then I completely agree with what you say. But if this is simply about saying: if your system has an edge then moving from say a max of 10 simultaneous open positions to a max of 20 simultaneous open positions then I don't agree with that. But I think you are referring to the former and not the latter?
indeed, that's where I was a bit confused: I had 2000 or so trades min in the given example, we are not exactly talking about small numbers here?
One thing certain: I used that % of assets per trades in all my backtests development in the last 2 y and it certainly seems to twist things; especially the return per max number of positions but even win rate: why the hell would win rate drastically change
Not sure I fully understand why: yes scoring is more important yes we speed or miss some rebound options but I would not expect that much change like win rate.I hate not understanding something, there must be a clear explanation but this is what it is and my aim is not to improve an hypothetic backtest but improve statistically the system performance
So based on the few runs I did , I believe testing and fine tuning with fixed amount per trade is MUCH more useful.
I will so rerun/retune my systems in this new light..and will be quiet for a while. :)
will give you a short summary of this experience when completed
 
indeed, that's where I was a bit confused: I had 2000 or so trades min in the given example, we are not exactly talking about small numbers here?
I don't want to distract you from your current endeavors, but you might want to put this on your list of things to research in the future. To determine whether your 2000 trades is statistically relevant you need to put it into context. For example, if the 2000 trades was in the context of a possible 2 million trades then I would say 2000 trades is not a large enough sample size, but if the 2000 trades was in the context of a possible 3000 trades then I would say that is a good sample size. So how do you find out how many possible trades there are? You can easily do that in AB. I use the scan function (with a little AFL) to do a dump of all possible trades. You can use the output of the scan to see if your back test has taken a statistically relevant number of trades.
 
Top