Australian (ASX) Stock Market Forum

Dump it Here

???
You have a system, do have gains you are afraid to loose and want to override your system.
At the very least,give a chance to your system to be proven right and instead of putting a sell order, put a sl order.
Conditional sell...
Anyway,just my view, each to his her own
Because of the specific exit I use in that system I know that historically rapid rises like this tend to give back (not all). This particular trade is an outlier and I know how my system responds to similar scenarios—hence my concern.
 
Because of the specific exit I use in that system I know that historically rapid rises like this tend to give back (not all). This particular trade is an outlier and I know how my system responds to similar scenarios—hence my concern.
What about coding it as part of your system and see if statistically you are better off or not?
If it helps:
Do not want to lead the thread away but this is a dangerous slide if you start mixing feeling and ..not so..systematic trading.
for you to decide.Peter openly uses a mixed approach,system doing the early detection and signal, discretionary decision then and this is fine as it is the design.

I was under the impression you were following a more systematic approach, and if so i believe you should have a think then and maybe code an exit if you wish too, but away from the heat of the moment.
A great opportunity actually as you will sell, per system on monday and so wo pressure

I often think about coding it, but just haven't got around to it yet. Other fish to fry at the moment. I'm more focused on managing the downside, but I could do a simple assessment by implementing AB's Profit Target. I do trade purely systematic and my system always alerts me to outliers, which this is. I'll often review the outliers as means for doing a sanity on the overall system's behavior.
 
Interesting, thanks Joe.

I'm curious that they compare TSI to ADX and state most people use ADX as a trend filter. I've spent a bit of time evaluating ADX over a range of scenarios (admittedly only on the ASX) and it has always been a massive disappoint for me. I've revisited it many times over the years and nothing. I don't actually know any one that uses ADX as a serious trend filter and in fact I'd love to know if anyone here actually uses it? Maybe ADX works well on the Nasdaq but my experience tells me it is horrible on the ASX.
 
Thanks Skate, your post on the TSI is good info. But I believe you are referring to the True Strength Index whereas MA was referring to the Trend Strength Index.

Assuming
Reminds me of a story of a bereavement card being notated with (LOL) the sender assumed (LOL) meant (Lots-Of-Love)

Who would have thought?
(WTF) Some acronyms are sometimes confusing & by the way how others interpret them. I assumed (WTF) meant (Way-To-Funny) or is that just me?

Let's talk about the real TSI in question (The Trend Strength Index)
True Strength & Tend strength - there is a difference. I should also thank @Joe90 for the hyperlinks that I also appreciated. Straight off the bat, there are similarities between an "Average Directional Index" (ADX) & a "Trend Strength Index" (TSI). Both of these, are trend strength indicators & not trend directional indicators. With Trend Strength, you need to understand that they can be either going up or going down.

Backgrounding
To clear up the confusion of acronyms - I'll make a brief description of the recent indicators & their individual uniqueness.

TSI (Tend Strength Index)
Unfortunately, the "Tend Strength Index" (TSI) does not reveal the trend direction. The "Tend Strength Index" (TSI) behaves differently under differing conditions that users should be aware of. The "Tend Strength Index" (TSI) gives "strength reading" in Up-trends, Down-trends & at times in Sideway-trends. Also, if the "Tend strength Index" (TSI) is not used or coded correctly this indicator can catch you off guard "quick smart" when price reverses quickly. Why? - because the "Tend Strength Index" (TSI) does not indicate trends, but rather indicates the strength-of-them. To summarise, the (TSI) is not a trend indicator, but a "strength of trend indicator", whereas a good "True Strength Indicator" used in conjunction would be able to ignore those situations.

True Strength Index (a directional indicator)
Simply put, the "True Strength Index" (TSI) is a double smooth momentum oscillator of changing prices that reveals the direction of the trend. The "True Strength Index" (TSI) initially captures these fluctuations then applies "double smoothing" to reduce the lag of these signals.

ADX
Unfortunately, the (ADX) also does not reveal the direction of the trend. The average directional index (ADX) shows the strength but not the direction of the price that is trending. Trading in the direction of a strong trend reduces risk & increases profit potential. The (ADX) & (TSI), are both "Trend Strength indicators" & can be confusing to use because both are interpreted differently from other indicators. Most indicators move up when prices rise, and they fall when prices decline, that’s not necessarily the case with both the (ADX) & (TSI) indicators.

MACD
As a reference was made about the "Moving Average Convergence Divergence" (MACD) indicator, it's only fair that I give a brief outline of this indicator. On the other hand, the (MACD) indicates price momentum that identifies price direction as it rises above its trigger line or falls below its zero-line. To summarise, the (MACD) by designed reveals changes in the strength, direction, momentum, & duration of a trend.

I trust this clears up my confusion of the acronyms.

Skate.
 
Last edited:
Interesting, thanks Joe.

I'm curious that they compare TSI to ADX and state most people use ADX as a trend filter. I've spent a bit of time evaluating ADX over a range of scenarios (admittedly only on the ASX) and it has always been a massive disappoint for me. I've revisited it many times over the years and nothing. I don't actually know any one that uses ADX as a serious trend filter and in fact I'd love to know if anyone here actually uses it? Maybe ADX works well on the Nasdaq but my experience tells me it is horrible on the ASX.
Off the top of my head, the CAM system uses it.
 
Excuse my ignorance...CAM?

1. The CAM Strategy - summary
The CAM strategy buys pullbacks in existing trends and buys countertrends when the rally continues.
0001A. CAM Strategy.jpg


(a) The CAM Strategy - Trading Plan (Enter LONG)
Buy before the open on Monday in the pre-auction at the open if today (Friday) is a GOLD-coloured bar [which represents the CAM-PB, meaning that both the 10-period (ADX) and (MACD) are declining] but the 14-period (CCI) is above zero, - OR - if today (Friday) is a BLUE-coloured bar [which represents the CAM-CT, meaning the 10-period (ADX) is declining but (MACD) is rising] and today’s close crosses above the 13-period EMA.

(b) The CAM Strategy - Trading Plan (Exit LONG)
Sell before the open on Monday in the pre-auction if Fridays end of close is a RED-coloured bar [which corresponds to the CAM-DN, that is, the 10-period (ADX) is rising but the (MACD) declines] and today’s (Friday) close is below the 13-period EMA.


Skate.
 
7. The Sphere Strategy Logo.jpg

Update (2).png

My apologies
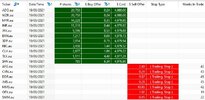
I posted a stored progressive data snapshot for the Sphere Strategy (yesterday) instead of the exploration analysis signals from the final adjusted data set. I'm sure it would have made no difference as the updated signals would have been selected rather than the incomplete signal, I posted yesterday. The new Exploration list is for the accuracy of the exercise.

4. Sphere Signals Capture.JPG

Skate.
 
View attachment 121634

View attachment 121635

My apologies
I posted a stored progressive data snapshot for the Sphere Strategy (yesterday) instead of the exploration analysis signals from the final adjusted data set. I'm sure it would have made no difference as the updated signals would have been selected rather than the incomplete signal, I posted yesterday. The new Exploration list is for the accuracy of the exercise.

View attachment 121636

Skate.
I tried quickly to incorporate the tsi to control the entries of some existing trend systems,
No improvement i could see. .
anyone using tsi?
 
I tried quickly to incorporate the tsi to control the entries of some existing trend systems,
No improvement i could see. .
anyone using tsi?
Yes I’m actively using it, but I only use it to switch between different systems—I don’t use it to filter buys sigs within a system
 
I tried quickly to incorporate the tsi to control the entries of some existing trend systems,
No improvement i could see. .
anyone using tsi?
Not sure how you tried it, but keep in mind it doesn’t indicate trend per se. You should use a trend indicator (eg MA cross over) and use TSI to confirm with current trend is strong, weak or indifferent.
 
I tried quickly to incorporate the tsi to control the entries of some existing trend systems,
No improvement i could see. .
anyone using tsi?

Not sure how you tried it, but keep in mind it doesn’t indicate trend per se. You should use a trend indicator (eg MA cross over) and use TSI to confirm with current trend is strong, weak or indifferent.

My clarification
Using the "Tend Strength Index" (TSI) has its limitations inasmuch that it confirms the strength of the trend rather than the trend direction. The practical application of a "Tend Strength Index" (TSI) as a stand-alone indicator as-far-as I'm concerned is stifled by its inherent limitations. Matching the "Tend Strength Index" (TSI) with other indicators there are slight improvements - but nothing to write home about.

True Strength Index (a directional indicator)
The "True Strength Index" (TSI) has strong trading applications as it reveals the direction of the trend & captures it nicely. The "True Strength Index" (TSI) reduces the lag of these signals which is the real head-turner.

Summary
1. The "Tend Strength Index" (TSI) has limited practical applications.
2. The "True Strength Index" (TSI) is a different "kettle-of-fish" & I've recently posted the backtest results of a stand-alone strategy using the "True Strength Index". The "True Strength Index" (TSI) is a perfect engine of an entire trend strategy. A (V8) engine at that.

Combining the indicators
Adding the "Tend Strength Index" (TSI) to the "True Strength Index" (TSI) & using it as a stand-alone strategy the buy condition improves slightly. Using both indicators in unison has practical applications & slight improvement can be achieved.

Skate.
 
anyone using tsi?

@qldfrog I've used both (TSI) indicators with success combing an "AND" & "OR" statement annexed to the buy condition. Using both indicators reduce false breakouts of forming trends.

A simple line of code
Using the zero-line of the "True Strength Index" (TSI) oscillator has strong trading applications, so has the "Tend Strength Index" (TSI) under certain conditions - using both indicators with filters & tuned parameters certainly adds value.

Sample Code for @qldfrog
BuyTSIsetup = TSI AND sig > 0 OR TSIndicator > 1.65;

In English
When the double smoothed (TSI) & the signal line are both higher than zero - forms the first part of the buy condition. The "OR" statement becomes an additional buy condition. So, if the "Tend Strength Index" (TSI) is greater than 1.65 (the standard measure of trend strength) is the other buy signal (but limited). Add parameters & other filters to the system & it becomes a worthy trend strategy.

Skate.
 
Not sure how you tried it, but keep in mind it doesn’t indicate trend per se. You should use a trend indicator (eg MA cross over) and use TSI to confirm with current trend is strong, weak or indifferent.
Thanks: Yes, understand that .
Was added as an AND tsi>xx to existing trend system but only reduced results,did not reduce dd either on the very quick tests i did.
I have to highlight this was not an extensive proper investigation and was added on top of existing properly tested systems.
I might not have much room for improvement on these...
 
Hope this is the right place, but I'm in the mood for a dump on trading psychology. I really struggle with the extremes of trading and the up side extreme is just as challenging for me. I'm seriously tempted to override my system and sell before close today--I've never gotten used to massive rises in a short timeframe and my experience tells me such rises come back to earth just as quickly. Bird in the hand and all that stuff.

@ducati916 answers your concerns about trading psychology with his perfect summation.

ducati916 said:
The thing with having many balls in the air concurrently, is that the market can chop and change rapidly. Trends appear and disappear very quickly. Holding positions becomes harder to do. The impact on trader psychology is to increasingly grab quick profits. It becomes habit forming and that much harder to sit in a trade for the big(ger) gains that are available in catching a good trend.

Trading psychology
@ducati916 sums up trading psychology precisely - not only in "general terms" but adds special meaning, especially with the current market conditions. There is no denying that this calendar year trading has been a tough gig so far. Meaning, with current trading conditions, sticking with your trading plan becomes difficult if not impossible for most.

Skate.
 
@ducati916 answers your concerns about trading psychology with his perfect summation.


Trading psychology
@ducati916 sums up trading psychology precisely - not only in "general terms" but adds special meaning, especially with the current market conditions. There is no denying that this calendar year trading has been a tough gig so far. Meaning, with current trading conditions, sticking with your trading plan becomes difficult if not impossible for most.

Skate.
not impossible but hard indeed, see my posts after 2 weeks of $4k or so loss a day..day after day..part of it was discretionary, but even for discretionay there was a plan behind the discretionary: "make money" , not "lose 20k a week" :)


"If you've bought right, all you have to do is hold tight"

@MovingAverage Have you had any hedges in place? I bought banks & energy/oil a while back and have watched them soar while all my tech holdings have been smashed over the last month. I'm about even over the last 4-5 weeks as a result.

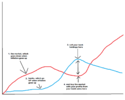
I also wonder if you're not looking at the upside here - if you have a situation where A is down but B is up TEMPORARILY, then that's a golden opportunity to take your profits from B and pump them into A when the market flips back in the other direction again.

I just made a series of giant posts over in the economic implications of coronavirus thread explaining why I think this move is temporary just FYI :)

Thanks for the response. I’m a simple man and like to keep things simple so don’t bother with hedging. I do a little foreign investing and will, when possible, hedge for FX movements but I don’t bother hedging for domestic positions. Curious, by taking profits in B and pumping into A when down are you referring to a dollar cost averaging strategy? If so I’m not a fan of that, but that’s just me personally. Thanks again
 
Thanks for the response. I’m a simple man and like to keep things simple so don’t bother with hedging. I do a little foreign investing and will, when possible, hedge for FX movements but I don’t bother hedging for domestic positions. Curious, by taking profits in B and pumping into A when down are you referring to a dollar cost averaging strategy? If so I’m not a fan of that, but that’s just me personally. Thanks again
Nah different thing.

At the moment the market is getting smashed by inflation expectations. But there are some things which run up (and run HARD) when inflation goes up - banks for example.

Untitled.png

The inverse correlation between the two (the fact that they move in opposite directions to each other) provides a golden opportunity if a flip in the opposite directions is only temporary like this ultra-high-tech graph I've drawn has.

You would obviously only do this if you think that the two curves are going to revert to their previous trend/what we see at the moment is only temporary though (which I do).
 
Top