Australian (ASX) Stock Market Forum

Dump it Here

for newbies like me: whar is signal? in MACD case:
The signal line is a 9-day EMA of the MACD line. As a moving average of the indicator, it trails the MACD ....
Basically a smoother view of the indicator to remove noise.Dummies like me need full explanation :)
:xyxthumbs Although in my case the signal I use with my TSI is not a 9-day EMA of the TSI.
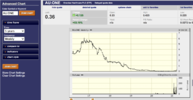
 
Sorry MA, not sure I understand what you mean about signal line?
I want to clear up a few points
@Wilham raised a valid point & asked about additional information from @MovingAverage to which trend indicator he uses.

Interest turned to the (TSI) indicator
Simply put, the (TSI) is a double smooth momentum oscillator of changing prices. The (TSI) captures these fluctuations & then applies smoothing. Pretty simple really.

Let me explain the (TSI) in English
The (TSI) is a calculation of the price change from one period to the next. It is accomplished by calculating a 25-period (EMA) of this price change. (the first step of the process)

Here is the twist for double smoothing
Then the results of the first step - calculate the 13-period (EMA) of this 25-period (EMA). Wham, bam, thank you, mam - we have just created double smoothing.

The Signal Line
@qldfrog was curious about the signal line. The signal line is simply an exponential moving average of TSI. @MovingAverage made the reference to the (MACD) signal line as a mental comparison & the comparison stops there.

The Buy Signal
In my previous post, I used a simple "Signal line crossover" to demonstrate the simplicity of getting into an uptrend. Using the zero-line cross is the simplest way to generate a signal. (posted previously)

For the more advanced
The first part, which is the double smoothed price change, sets the (+/-) representation of the TSI. The indicator is negative when the double smoothed price change drops below the (zero-line) & positive when it's above the (zero-line). The double smoothed absolute price change normalizes the indicator & limits the range of the (TSI) oscillator.

In other words
The TSI indicator measures the double smoothed price change relative to the double smoothed absolute price change. A string of large positive price changes results in relatively high positive readings, signalling strong upside momentum. A string of large negative price changes pushes the TSI into negative territory.

The (TSI) is an oscillator that fluctuates between positive & negative in relation to the zero-line
As with many momentum oscillators, the centreline defines the overall bias. Positive momentum when TSI is above the (zero-line) & negative momentum when it's below.

If this has sparked an interest
You can find more about momentum indicators by doing a "search by @Skate" - I'm sure I've made dozens of posts on the subject.

Skate.
 
I think you need to assume that many here on ASF are completely new to trading

The summation by @Beaches nailed it.
At times I'm guilty of explaining the not-so-obvious with an understanding that's what's obvious to most is not obvious to all. At times readers will ask a technical question that relies on a technical answer. The (TSI) indicator raised interest with even the more seasoned readers of this thread thus a post to explain a simple indicator in terms that can be understood.

Back to @Wilham
Asking questions is how we learn but questions should be the last resort not the first. Searching for answers is the first port of call - having those answers clarified is another. (Education is something that is done to you. Learning is something you do for yourself)

I wish to make a general observation
I'm just saying - if you have a crazy idea by all means test it to death. But if you are testing a trading idea as the (BBO Strategy) that's has a zillion "Publicised Backtests Reports " with a library of books written about the implementation of the idea - why is there a need for additional confirmation of results?

The internet is awash with published (BBO) code with backtest results
Pick one & if it displays a positive expectancy & you have an urge to trade - trade it with small amounts at first till your confidence & experience increase.

Skate.
 
Hope this is the right place, but I'm in the mood for a dump on trading psychology. Might be a welcome break from all that boring chat about statistics. I really struggle with the extremes of trading and the up side extreme is just as challenging for me. On Monday of this week I entered a long position on ONE with an entry price of around $0.17. Nothing special was just another one of my system buys for the day. ONE has had a massive jump in the past few days and as of a few minutes ago it was trading at around $0.40 so I'm at around 130% up. I'm seriously tempted to override my system and sell before close today--I've never gotten used to massive rises in a short timeframe and my experience tells me such rises come back to earth just as quickly. Bird in the hand and all that stuff.
 
Hey @MovingAverage This is definitely not advice. Personally, it depends on why I initially bought any given Stock s as to how much wiggle room I give it.

ie Buy-hold/investment, or purely a trade?

A filter which I often check on a Stock that has had ultra high intra-day Volume, is the VWAP

I checked ONE and today it's VWAP is currently sitting around 34.7 cents. The SP when I started typing was 38 cents (now 37.5)

So there have been a lot of shares traded at above the VWAP

Definitely not a red flag, but might be worth considering when sitting on large gains??

ps I don't trade systems, so take with a grain of salt

pps I wonder if some kind of back test could be done to see the historic relationship between large moves relative to VWAP and where a Stock Closes in relation to said daily moves etc etc?? Mr. @Skate? ;) :happy:

Cheers.
Certainly appreciate your perspective.

This gain is a significant outlier for my system--hence my nervousness. I should probably pay more attention to VWAP :xyxthumbs
 
I should probably pay more attention to VWAP :xyxthumbs

:)Yeah it won't tell you when to Buy or Sell of course, but it definitely gives perspective knowing at what level the bulk of the money changed hands over a given day (and more importantly, days)

Bit hard with ONE today because of the huge one day spike. It closed at 37.5 with a VWAP of around 34.5 so at least today, that is positive price action.

Hopefully Mr. Skate might have done a little research on it's usefulness :)
 
market conditions.

Hope this is the right place, but I'm in the mood for a dump on trading psychology. Might be a welcome break from all that boring chat about statistics. I really struggle with the extremes of trading and the up side extreme is just as challenging for me. On Monday of this week I entered a long position on ONE with an entry price of around $0.17. Nothing special was just another one of my system buys for the day. ONE has had a massive jump in the past few days and as of a few minutes ago it was trading at around $0.40 so I'm at around 130% up. I'm seriously tempted to override my system and sell before close today--I've never gotten used to massive rises in a short timeframe and my experience tells me such rises come back to earth just as quickly. Bird in the hand and all that stuff.


So never heard of it.

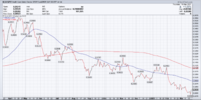
This is it?

Screen Shot 2021-03-19 at 6.30.46 PM.png

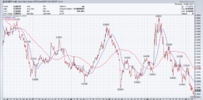
Some US context:

Screen Shot 2021-03-19 at 6.32.48 PM.png

Screen Shot 2021-03-19 at 6.31.43 PM.png

Healthcare on a bit of a bounce. Does it start a new uptrend?

Maybe yes, maybe no. Too early to tell.

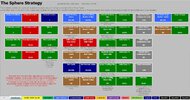
Screen Shot 2021-03-19 at 6.36.20 PM.png

jog on
duc
 
:)Yeah it won't tell you when to Buy or Sell of course, but it definitely gives perspective knowing at what level the bulk of the money changed hands over a given day (and more importantly, days)

Bit hard with ONE today because of the huge one day spike. It closed at 37.5 with a VWAP of around 34.5 so at least today, that is positive price action.

Hopefully Mr. Skate might have done a little research on it's usefulness :)
My system is flagging it as a sell for Monday so my dilemma is solved for me :cool:
 
pps I wonder if some kind of back test could be done to see the historic relationship between large moves relative to VWAP and where a Stock Closes in relation to said daily moves etc etc?? Mr. @Skate? ;) :happy:
Hopefully Mr. Skate might have done a little research on it's usefulness :)

@barney the issues you raised, frankly, I never think about (or want to). The issue @MovingAverage raised, those of trading by emotions - I've covered many times before in this thread.

I keep my trading style simple & consistent
I get in - I get out & everything in between is out of my control. My energy is spent researching new trading ideas & sharpening the signals of the strategies that I already trade. When you get a series of trades under your belt (experience) you tend to roll with the punches rather than reacting to them.

Skate.
 
When you get a series of trades under your belt (experience) you tend to roll with the punches rather than reacting to them.

Skate.

Just sharing my observations and experiences. I spend a lot of time with professional traders (both quants and non-quants)--some of these guys would do more trades in a month than others would do in several lifetimes. For a lot of those guys the emotion is always there. In retail circles the phrase "next 1000 trades" is often thrown around, but to be honest I think finding that state is like finding nirvana.
 
@barney the issues you raised, frankly, I never think about (or want to).

I was just about to reply with another post, but thought better of it.

Adding my discretionary biases seems inappropriate on your Thread.

So I will gracefully retire back to my cave of apparent randomness, lol:bucktooth::happy:

Appreciate your thoroughness as you know!;)

Cheers.
 
Here is a link to the original article: https://engineeringreturns.wordpress.com/tsi/

I've made a few tweaks to my implementation, but it is fundamentally the same.
Thanks. You get more hits when you understand that the I in TSI stands for "Index" instead of "Indicator".

Interest turned to the (TSI) indicator
Simply put, the (TSI) is a double smooth momentum oscillator of changing prices. The (TSI) captures these fluctuations & then applies smoothing. Pretty simple really.

Thanks Skate, your post on the TSI is good info. But I believe you are referring to the True Strength Index whereas MA was referring to the Trend Strength Index.
 
My system is flagging it as a sell for Monday so my dilemma is solved for me :cool:
The most overide I would ever consider is a SL, in no way a sell if Ido system trading.
Already adding an untested SL is really really borderline:
the way I see it: how/who am I to even think I can guess the market..
 
The most overide I would ever consider is a SL, in no way a sell if Ido system trading.
Already adding an untested SL is really really borderline:
the way I see it: how/who am I to even think I can guess the market..
See to me I don’t really ever think about over riding a SL. A correctly implemented SL will always kick in right? In what situation would you override a SL? I often think about exploring a profit exit to address the concern I have about giving up significant rises. Yes a SL is there but you will always give up a reasonable amount of unrealised profit if just using a SL
 
See to me I don’t really ever think about over riding a SL. A correctly implemented SL will always kick in right? In what situation would you override a SL? I often think about exploring a profit exit to address the concern I have about giving up significant rises. Yes a SL is there but you will always give up a reasonable amount of unrealised profit if just using a SL
???
You have a system, do have gains you are afraid to loose and want to override your system.
At the very least,give a chance to your system to be proven right and instead of putting a sell order, put a sl order.
Conditional sell...
Anyway,just my view, each to his her own
 
That's pretty much it. There are some interesting discussions on another forum about this indicator and a few interesting suggestions for refinement. You can also add a signal line to the TSI (which I use in conjunction with the TSI), which is the main difference between my version and the TSI as originally proposed

Some background on how to use the Trend Strength Index, including performance stats...
https://cssanalytics.wordpress.com/2010/06/28/trend-strength-index-tsi/
https://cssanalytics.wordpress.com/2010/06/29/trend-strength-index-tsi-results-summary/
http://www.nonrandomwalk.com/Blog/tsi.html
 
Top