DrBourse
If you don't Ask, you don't Get.
- Joined
- 14 January 2010
- Posts
- 891
- Reactions
- 2,112
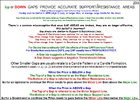
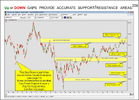
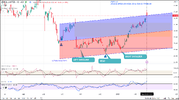
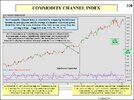
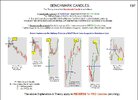
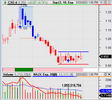
 ….. It is an example of “Overlapping Benchmark Candle Formations” (pages 197 to 199)……..Note that the RED parameters change to BLUE when the 2nd BCF forms….
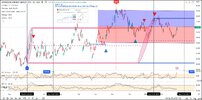
Re reading this heading n today i/3/23, Uranium seems to be baking HOT.i already have a comfortable amount of BHP ( i even resisted joining the DRP )
to ME , BHP ( currently ) looks to me like a 'serial stumbler ' much like modern WOW
i would be ( currently ) more inclined to add the profits in extra S32 ( and MAYBE even part of the OZL proceeds , when they arrive )
as i think i need a little extra growth in my portfolio ( to help resist inflation )
now oil price .....
i see a disconnect coming as much of the OPEC+ production will circumvent the Petro-dollar and therefore the major commodity markets ( Singapore might be a BIG winner here ) funneling much refining activity to India and China
will the oil rice become just as notional as the 'official' gold price ( very different from what the retail buyer can take it home for )
BTW i do not debate Dr. B's calculations , only what I would do if they come true
i also notice an uptick in talk about uranium , keep an eye on BHP to see if they expand Olympic Dam , there is a useful amount of uranium there ( allegedly )
Dr B...? you are frightening the newbies off. So so so much to read understand n digest or is it to retain in the memory bank.Dr Bourse Message for NEWBIES…
This post is for the “Wanna-be” Newbie Share Traders…..
The following may seem harsh to you, but I'm trying to stop you losing money….
Basically there is a lot to learn about this industry, but IMO you HAVE started off with the correct approach, by asking questions….
Here are a few suggestions for you to contemplate…
These are in no particular order…..
I’m just going to drop suggestions one after the other as they come to me…
What Tier Data Provider do you use, Tier 1, 2, 3 or 4 - depending on your trading time frames, some of us could have bought and sold the share you want to buy, 2 or 3 times before you get your data, so be careful what Share Trading Platform you use….
You need to know what certain “external events” have on stocks, particularly when they happen outside Trading Hours – for example how do stocks react to Interest Rate Changes, or to Commodity Price changes – for example a Mining Stock may rise or fall when Iron Ore or Gold prices change, but Health Funds may not react….
How will you identify a Positive History – Companies only issue Financials periodically through the year – any Financial or Rumour effects on a Companies Financials are interpreted differently by various analysts – which one will you believe – or are you able to dissect a Balance Sheet ….
A Stocks History over 12 mths is irrelevant… A Stocks History is normally 5 to 10 years….Which of the approx 50 Ratios and/or 30 Margins of Safety would you be looking at to help evaluate a Positive History??..Which of these Buffett style calculations would you be using to help your evaluation of a stock:- DDM, DDMF, GIVF, PRESVAL, RIV, ERI, NCAV, PAYBACK, PEG, PEGY, STRET, STRETD, TARG, TARGD, EGROWTH, ESAFETY, PESAFETY, (there are several others)….
Do you know what the overnight “ASX SPI” is, and how it will effect todays Share Prices….
Do you understand how Stocks react to certain Political Decisions....
Do you know what time the Economic Clock is ATM....
Do you understand the S&P Credit Rating System for Companies (AAA, BBB, etc), and what those ratings mean to a Company….
Do you know what ‘Minor Irritants’ such as Algorithmic Traders, Swing Traders and Option Traders do and how they effect a companies share price…
Do you know IF your chosen Stock CAN be Shorted…
Do you understand how Short Selling effects your chosen Stock….
Do you calculate your own “Intrinsic Values” – if not why not??..
Do you know what Australian ADR Stocks are - do you know how they effect their Australian equivalent....
Do you check Overseas Exchanges to see how Australian Dual Listed Stocks performed yesterday, their + or – for the day is usually reflected here in Aust…
Check out the NCM Stocks on the Dow Jones – Start by searching for NCMGF and NCMGY…
Don’t Trade too many stocks at the same time, it is not easy, while you are winning and watching your profits grow on say 2 or 3 of them, the others can quickly reverse and obliterate any profit you thought you may have had….
Why not trade 2 or 3, have all 3 charts and all 3 Market Depths on multiple screens at the same time, and watch them “like a hawk”….
Don't take tips on face value…
Be careful of forums like Hot Copper (BS could be a better abbreviation for some posts there). There is gold to be found in all stock forums but sometimes you have to sift through a lot of less desirable gold coloured material to find it!....
Paper trade for 6 months to prove you are not going to lose your money….
Don't gear your investments with products like CFD's unless you really know what you are doing. My recommendation is don't gear - full stop…..
Get some education in trading so you can do your own research and not become a lemming (ie follow someone else over a cliff)…..
Beware if trading a performing sector, as it is more likely to become an underperforming sector much sooner than most of us expect….most of us are already in those “performing sectors”, we are just waiting to sell our holdings to you….We have already used our Tools of Trade to get into performing sectors before they started to rise in value, we have also used those tools to evaluate an approximate “Exit Point”….
Be careful if you decide to trade for “Dividends Only”, The ATO likes Traders/Investors with that approach…
What timeframe are you looking at to carry out your Technical &/or Financial Analysis over….
For Technical Analysis what do you know about Charts, or Chart Indicators, or Candlesticks etc…..
For Financial Analysis what do you know about Ratios, or Margins of Safety….
Do you understand Balance Sheets, can you correctly interpret the figures they quote…..
What type of charts are you using, Linear, Log or Arithmetic, Each Chart Type produces slightly different outcomes when conducting Chart Analysis…..
Do you understand Technical Analysis Tools like Charts & Indicators, do you understand how to read them, do you understand what they are telling you…?
Do you use any other indicator over or on top of your Chart or Basic Indicators – if not, why not…
Personally, I use several indicators on all my charts, IMO that gives me several different points of view on the Technical Merit of a stock – why would you only rely on one….
IMO, Traders should not get too involved with STOP LOSS points - I do not use a Conventionally Accepted STOP LOSS or TRAILING STOP LOSS System….I feel that those systems belong to the Longer Term Investors….Once I have in my opinion, enough Signals/Signs from my Tools of Trade, I will act immediately….For example if a Bearish Candle Pattern and/or my Indicators suggest that a pullback or downtrend is imminent I will follow those signals and exit the Trade immediately....If I were to use a % Stop Loss System (of say 2%) and my Tools of Trade gave me enough signals to exit for say 0.5%, I would be crazy to hold and watch any small loss be increased just because that “% Stop Loss System” told me I had to wait till my losses reached that magical 2% - it would be easier to just give some money away....Admittedly I sometimes exit a trade early – but I prefer to be cautious – and if my Tools of Trade suggest continued uptrend then I can easily re-enter the Trade....- the idea is to trade when there is a trade to be made, and even then you should 'Play the Trade' (like playing a Fish), you should not trade the $$$'s - get the trades right and the $$$'s will automatically follow…
Do you know what the “ASX staggered Open Times are”.
Do you know what the “ASX Pre-CSPA Times are”.
Try this site Cash market trading hours (asx.com.au) .
Do you know what Candle Construction is and how to interpret it…?
Do you know what Tick and Intraday Charts are and how they relate to Daily Charts……?
Emotion and Intuition are very useful in this industry – do not disregard either one...
Experienced traders do NOT make money off fellow Traders – We profit from mistakes made by Newbies…
Let me know when you master all of the above aspects of this profession – I will then post the more complicated 10 pages of “what you need to know” if you are going to dabble in this Sand Pit.
Good Luck...
DrB.
you could always try to sweet-talk Joe Blow into adding a bookmark feature to member's accountsDr B...? you are frightening the newbies off. So so so much to read understand n digest or is it to retain in the memory bank.
OK NP, sometime later this arvoGood afternoon Dr Bourse
Be most appreciative if you could run your TA ruler across AGG please.
Kind regards
rcw1
Hi peter,....Thnx for that.....will have a look at it over the W/E....
awesome , i hadn't discovered that feature either
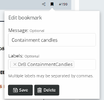
Hi peter..... where/how do we access existing Bookmarks......DrB
@divs4ever and @dr_bourse you silly sausages …, ha ha haawesome , i hadn't discovered that feature either
thanks for that

DrB,
Bookmark function here.
No idea how the Message and Labels option work, but something to do with a search algo.
View attachment 153853
Hi sean...DrB,
Bookmark function here.
No idea how the Message and Labels option work, but something to do with a search algo.
View attachment 153853
Hello and welcome to Aussie Stock Forums!
To gain full access you must register. Registration is free and takes only a few seconds to complete.
Already a member? Log in here.