Australian (ASX) Stock Market Forum

DrBourse TA Help for Beginners

I am reposting this from the SVW Forum for the benefit of any beginners that missed the original post dated 4/5/23..

4/5/23 11am – SVW looks interesting……

Note the Entry Signals, Blue Triangles & the Thin Blue Vertical Lines, then note the Candle Colours & the CCI Indicator movements…..

Same with the Exit Signals, Red Triangles & the Red Dotted Vertical Lines, then note the Candle Colours & the CCI Indicator movements…..


The Triangle code is Blue B, P or K = Buy, ….. Red S, P or K = Sell….

The Blue B = Buy, the Blue P = Piercing Candle Formation Signal, the Blue K = Kicking Candle Formation,

The Red S = Sell, the Red P = Piercing Candle Formation Signal, the Red K = Kicking Candle Formation…..

Explanation Snapshots of those above Blue & Red codes is below….
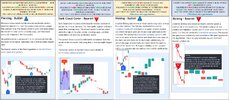
20230119-p-and-k-examples-jpg.jpg

Been 3 reasonable trades since early Feb 23, could there be another one starting today…. Or should we wait for tomorrows TA B4 a decision is made…. Your Call.....

This mornings Chart is below…..
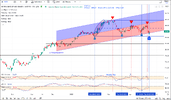
20230504-svw-cht-png.png

Again it’s a bit slow t’day, tomorrow will probably be the same, so I have to do something, may as well bore everyone to tears with some Educational ‘bits n pieces’….

REMEMBER THAT THIS TYPE OF TA WORKS FOR ME, IT MAY NOT SUIT YOUR NEEDS, SO DYOR….

Cheers...
DrB.
 
Hi,

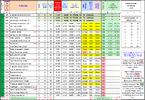
Not sure if anyone is interested, but here is the current list of stocks that I follow on my 1st Watchlist of 29 Stocks, 15 of which are interesting, and 14 not so interesting.

20230520 1600hrs 1st Watchlist.png

My 2nd watchlist has 102 stocks, and my 3rd watchlist has 19 stocks.

Remember to DYOR.

Cheers…

DrB.
 
Hi,

Not sure if anyone is interested, but here is the current list of stocks that I follow on my 1st Watchlist of 29 Stocks, 15 of which are interesting, and 14 not so interesting.

View attachment 157156

My 2nd watchlist has 102 stocks, and my 3rd watchlist has 19 stocks.

Remember to DYOR.

Cheers…

DrB.

You must have a degree in Excel, DrB. Very nice spreadsheets.
 
Hi,

Not sure if anyone is interested, but here is the current list of stocks that I follow on my 1st Watchlist of 29 Stocks, 15 of which are interesting, and 14 not so interesting.

View attachment 157156

My 2nd watchlist has 102 stocks, and my 3rd watchlist has 19 stocks.

Remember to DYOR.

Cheers…

DrB.
careful with AGG , it is planning to delist from the ASX
 
And here is todays useless bit of info:- ........
It's prob not much use to anybody, but posting this filled in a bit of my booring morning.......:(

sptrawlers post Nr 395 6/6/23, 3.19pm, in the Forum "RBA Cash Rate" suggested that he start a sweep - here now, today, my call is 5.10% before 7/6/24.......

The following Calculator and related web sites explains my methodology.

Remember that the figures below are used now, in calculating TODAYS Share Price, IV, and a few other Forward Calculations.

Obviously these figures below will change almost daily, so this is just a Snapshot in Time as at the day they are completed.

It only takes a few minutes to update this Calculator when needed - This Calculator is only one of several individual calculators that feed directly into my DrB IV, FA & TA Figures, However the entire DrBIV takes me about 1hour per stock.

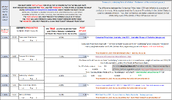
20230607 Calculator, CPI x 2, 10Yr Bond, RBA Cash Rate.png

Below are snapshots of the Four individual web sites that I use to source the Past Actuals needed..

Consumer Price Index, Australia, June 2021 | Australian Bureau of Statistics (abs.gov.au)
20230607 Calculator Consumer Price Index Path.png

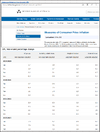
Measures of Consumer Price Inflation | RBA
20230607 Calculator Consumer Price Inflation Path.png

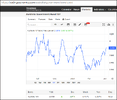
Australia Government Bond 10Y - 2023 Data - 1969-2022 Historical - 2024 Forecast (tradingeconomics.com)
20230607 Calculator 10Yr Bond Rate Path.png

RBA Cash Rate 2023: Current Interest Rates Australia | Savings.com.au
20230607 Calculator RBA Cash Rate Path.png

Copies of the Calculator "0230607 Calculator CPI x 2 10Yr Bond Cash Rate" are available FREE as an .xls S/S for anyone that is interested in a working copy - Private Message me to discuss.

Cheers...
DrB.
 
I humbly submit the following observations as todays useless “bit of info for the Beginners”:- …..

ATC’s Chart is currently providing some interesting TA signals……

From the Chart below you will notice that ATC has a recent habit of Rising, then dropping to similar Low Points (Points @ A, B, C & D)….

20230613 ATC Chart & Post.png


The Q now is, where to next?

From my perspective, tomorrow’s Candle will provide the answer.

A Rise from just above Point D tomorrow should suggest another ST Rise. To abt $0.115c

On the other hand, a drop to Below Point D, would suggest another drop to the expected Point E, to abt $0.075c.

If the SP reaches Point E, Then the same Q arises, Where to after that, Point F would be Very Questionable IMO.

The game I play with these, is when I find something interesting like ATC’s recent behaviour, is that I just bring it to the attention of others – then I like to leave everybody guessing…


Well, I have a Lowball Bid in @ $0.075c (Point E), and an even Lower Bid @ $0.060c (Point F)….

If ATC’s Candle is favourable tomorrow, guess what I’m going to do!


Now B4 you make any decisions, you should consider the 2 Indicators that I use, atm they are not very happy (pages 37 to 43, 95, 108 & 109), and in case you are wondering, NO I have not started drinking the hard stuff YET..

And for those doubters, I would like to remind them that this all came to light because of that Benchmark Candle Formation in Mid Sept 2022.


There are numerous other TA & FA signals in this ATC Chart, not going there today, the above is enough to give anyone a headache.
The Announcement from 13/6/23 influenced the SP for 13/6/23, and, IMO, as more people read that Announcement they will probably pump the SP up further....

Cheers..
DrB.
History is repeating itself exactly as predicted in my previous post …..

Looks as though my 14/6/23 call for ATC pulling back to Point E @ $0.75c maybe about to materialize….

What’s next for ATC ???..... Maybe “Point F, or ?”…..

Who Knows and Who really cares….
20230717 ATC Cht.png
 
I should remind everyone that my analysis is geared toward my expectations and is inheritantly Short Term Analysis......
Data I use has been gathered from various web sites, and has not been verified by me. All data, calculation and values have been collated for my personal information and should not be taken as correct ......
Before acting on calculations displayed, you should seek appropriate professional advice. I do not accept any responsibility for any losses suffered due to reliance on the data, calculations or values.....
Cheers.....
DrB.
 
Dr B, which way does this go?

View attachment 160680
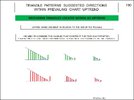
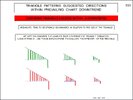
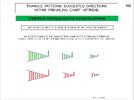
Page 187 Triangles 1.JPG
Page 188 Triangles 2.JPG
Page 189 Triangles 3.JPG
Page 190 Triangles 4.JPG
Page 191 Triangles 5.JPG
Page 192 Triangles 6.JPGHi Sean....
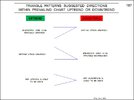
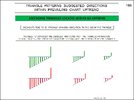
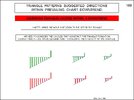
Bottom of slide #187 and all of slide #192 should give you some ideas to think abt....
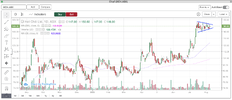
It's a Symetrical at the top of a ST Trend, so far it has 11 Green Candles & 7 Red Candles = Total confusion in the ST - I would need to wait for a breakout B4 I made a decision.....

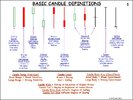
I could hazard a guess right now and suggest there is more downside as there is a Benchmark Candle Formation there as well, and of course you know all about a BCF, don't you!
PK
 
View attachment 160681
View attachment 160682
View attachment 160683
View attachment 160684
View attachment 160685
View attachment 160686Hi Sean....
Bottom of slide #187 and all of slide #192 should give you some ideas to think abt....
It's a Symetrical at the top of a ST Trend, so far it has 11 Green Candles & 7 Red Candles = Total confusion in the ST - I would need to wait for a breakout B4 I made a decision.....

I could hazard a guess right now and suggest there is more downside as there is a Benchmark Candle Formation there as well, and of course you know all about a BCF, don't you!
PK

Thank you.

I'm in this for the longer term fundamentals (5-10 year plan) but get excited when stocks form really interesting TA patterns. It normally means they crash on me. So this is probably a sell signal.

What has happened technically with this is that it smashed through $1.30 which was massive resistance. Hopefully that's a floor which is about my average price. I've had to wait 2 years to be in the black on this puppy. woof.
 
Just had a quick look for the HCH Financials - M8 There Ain't None ! .....
It's a PD from my perspective.......
GL anyway.....

and here is the BCF for your perusal....
20230808 HCH Cht 1255hrs.png
 
Today is 9/8/23 at abt 5.30pm....

I don’t often post abt stocks that I am interested in because TA being what it is can often backfire…. and because some people used to follow my thoughts, but did not know when to exit, so they became Holders, not Traders.....

Having said that, ILU really does interest me atm….


To me, ILU's TA suggests that a reversal is brewing…. Now I know that the Brokers & Analysts of this world do not like ILU for whatever reasons…. Basically I tend to ignore B & A’s (just in case you did not know)….. So much to Rederob’s annoyance I am a Contrarian, particularly ‘where & when’ Sheep are involved…..

At this point in time the B&A and the Sheep seem to dislike ILU… that’s part of the reason I like ILU….

The other part is ILU’s Financials meet all my parameters atm and rate as Very Good for both Ratios & Margins of Safety (MOS)….

Then there is the TA (my fav subject, just in case ya didn’t know)…..

ILU’s TA looks pretty compelling to me, as it also meets all my parameters atm….. Both the Linear Regression (pages 139 – 142) and the Benchmark Candle Formation (pages 197-199) set the immediate parameters for ILU’s next moves….

ST Indicators are Oversold, with some rising & some showing 5 day Entry Divergences (pages 45, then on most pages between 82 & 148)...

Note that ILU’s IV ATM is $13.30 and the IV Range is $12.37 to $14.23, with my TP @ $14.00…..

SO……

Here is a summary of my research to date for your perusal….

The FA was done 11/7/23 – the TA is as at today 9/8/23 abt 5.30pm…..
20230809 ILU (2).png

Note that I have purposely offset the 9/8/23 vertical line on the chart, just makes it a bit easier to read IMO….
20230809 ILU Cht (1).png
20230809 ILU Cht (2).png
20230809 ILU Cht (3).png
If you want to know more abt the Benchmark Candle Formation, read previous posts in this forum....

Had a few good trades since late Dec 22 and missed a few during May & early June 23…. That process may start again, Dunno……

I still need to see what tomorrows Candle represents by abt 11am, hopefully a Bounce off the $9.89 line….. – then I should be able to make a decision…. you will need to make your own calls...

A drop to below the $9.89 line will put everything on hold…. Then, I would be watching for an upturn B4 the $9.00 Line….

As I mentioned above, I’m interested in ILU ATM, that does not mean I will BUY ILU…..
This is just an educational piece for the resident beginners on what I am thinking & what I’m looking at ATM…..

If I have the time I will make follow-up posts on what I do next….


Data in this post has been gathered from various web sites, and has not been verified by me. All data, calculation and values have been collated for my personal information and should not be taken as correct...

I USE A SIMPLE GRADING SYSTEM - I Use fundamentals to select securities, not to trade them - NOTE THAT THIS FINANCIAL & TECHNICAL ANALYSIS MEETS MY NEEDS - I LOOK FOR CERTAIN THINGS WITHIN FA - THESE CALCULATIONS ARE FOR MY USE ONLY….

My requirements may not meet your needs - DO NOT MAKE YOUR DECISIONS BASED SOLELY ON MY ANALYSIS - Personally, I Use Fundamentals to Select Securities - THEN I Use Technical Analysis to Trade them - ALWAYS DYOR...

Before acting on calculations displayed, you should seek appropriate professional advice. Dr Bourse does not accept any responsibility for any losses suffered due to reliance on the data, calculations or values……

Cheers...
DrB.
 
Last Nights ILU OTC ADR ILKAF was down 6.06%, so this mornings ASX Open should have our ILU also down a bit.
So it looks like Plan B which = Wait'n'See...
20230810 ADR List.png
Need to watch this mornings Indicative Price/Change....
 
because some people used to follow my thoughts, but did not know when to exit, so they became Holders, not Traders.....
am much more a holder than a trader , so all i do is set a tolerable target price ( and let M&A and rare glimpses of common sense take care of the exits )

but yes have noticed traders love to bounce around ILU , but since it has divested DRR and SRX i don't see much value in a turbulent , uncertain global economy , maybe later when i think the global economy has resolved it's issues

( i hold ILU , DRR and SRX )
 
Top