Australian (ASX) Stock Market Forum

DrBourse General Help for Beginners

Another example of Information meant to Confuse Beginners - Hope you can follow the sequence below....
This post might also shine some creedence on my words in post Nr 100(above)....

The 1st snapshot below is self explanatory - Note the "USD$61 Outperform Target Price (= abt AUD$90.00)"....
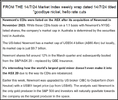
1721083712892.png

The next Snapshot is a list of Target Prices from a variety of Brokers showing an Average Target Price of $78.38....
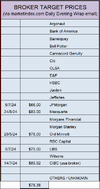
1721083881812.png

And Finally from the MarketIndex 15/7/24 @ 11.33am....
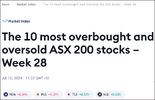
1721083765578.png

So which TP would you think is ok to use for your Research & Analysis....
14/7/24 USD$61 = abt $90AUD....
As at 15/7/24 $78.38 as an average from MarketIndex Morning & Evening Reports....
OR....
Then on 15/7/24 @ 11.33am MarketIndex suggest that NEM is suddenly OVERBOUGHT @ $70.00.....

And to add insult to injury,this morning 16/7/24 MarketIndex quote NEM in their Brokers Consensus List as shown below....
1721084901031.png

So which is it MarketIndex, Overbought @ $70.00 - OR - STRONG BUY @ A 12 Mth TP OF $78.66....

And all that above data & information came from MarketIndex on 14/7/24 & 15/7/24....
Pretty neat Eh!

One last comment from me, IMO an Intrinsic Value is a pretty precise thing if it is calculated correctly, BUT, on the other hand a Brokers Target Price is a Mythical Guesstimate based on each individual "Brokers In House Rules", as I have documented in numerous past posts in the 3 "DrB Help for Beginners Forums (General, FA & TA)"....

I've had the NEM IV @ $74.65 since early 2024....

Dr.B
 
Last edited:
Another example of Information meant to Confuse Beginners - Hope you can follow the sequence below....
This post might also shine some creedence on my words in post Nr 100(above)....

The 1st snapshot below is self explanatory - Note the "USD$61 Outperform Target Price (= abt AUD$90.00)"....
View attachment 180810

The next Snapshot is a list of Target Prices from a variety of Brokers showing an Average Target Price of $78.38....
View attachment 180812

And Finally from the MarketIndex 15/7/24 @ 11.33am....
View attachment 180811

So which TP would you think is ok to use for your Research & Analysis....
14/7/24 USD$61 = abt $90AUD....
As at 15/7/24 $78.38 as an average from MarketIndex Morning & Evening Reports....
OR....
Then on 15/7/24 @ 11.33am MarketIndex suggest that NEM is suddenly OVERBOUGHT @ $70.00.....

And to add insult to injury,this morning 16/7/24 MarketIndex quote NEM in their Brokers Consensus List as shown below....
View attachment 180813

So which is it MarketIndex, Overbought @ $70.00 - OR - STRONG BUY @ A 12 Mth TP OF $78.66....

And all that above data & information came from MarketIndex on 14/7/24 & 15/7/24....
Pretty neat Eh!

One last comment from me, IMO an Intrinsic Value is a pretty precise thing if it is calculated correctly, BUT, on the other hand a Brokers Target Price is a Mythical Guesstimate based on each individual "Brokers In House Rules", as I have documented in numerous past posts in the 3 "DrB Help for Beginners Forums (General, FA & TA)"....

I've had the NEM IV @ $74.65 since early 2024....

Dr.B
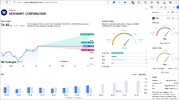
Then you dig a little deeper into TradingView in this case, where we find the following Target Price Analysis - analysis that I believe to be more accurate than most other publications....
1721088819203.png

Cheers..
Dr.B
 
Another topic that may interest beginners....

Each morning various outlets publish their guess on where our XJO will Open the day at…..

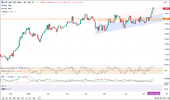
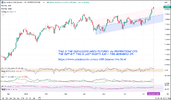
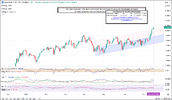
You too can calculate that anticipated figure by using the 3 charts below…..

17/7//24 6am....

OUR XJO CLOSED @ 7999 on 16/7/24....
1721170459062.png


THE AUS200 OVERNIGHT IN THE USA 16/7/24 @ 8048 +36 on 16/7/24....
1721170477082.png


AND OVERNIGHT IN THE USA THE AU200AUD CLOSED @ 8064 +36 on 16/7/24....
1721171612297.png


8048 – 7999 = +49

8064 – 7999 = +65

SO. ON AVERAGE, OUR XJO FOR 17/7/24 SHOULD OPEN @ +57....

Then at about 8.30am today 17/7/24 the calculated guesses roll in....

1721170518847.png

BINGO....

But Remember that this will never be an Exact Calculation because everyone would need to do their calculations at exactly the same time each morning, my calculation above was done @ 6am - MarketIndex did their calculations sometime before 8.35am....

DrB.
 
Last edited:
Monday 5/8/24 (after Close)

I tend to ignore the POG at times, then I tend to look for stocks that have “UP Days “, that is, their SP is DOWN , but for the day, they have a Green Candle, meaning that the SP for today has actually risen from Open to Close…. Stocks such as NEM, NST, RIO, NWS, PLS, SGM, SKC, FXG, IGO, RHC, & SFR just to mention a few… (check out the Candles)....

These are the stocks that have already begun their recovery from the current pullback - A lot of other stocks will not start their recovery for a few more days....

Then there is RMD, who have a RED Candle today, their SP closed 2/8/24 @ $31.80, their SP for today was $32.73….

These are the stocks that interest me – Forget what’s happening to Gold….

Focus on the +ives….

NOTE:- I might just add that my Candlesticks reflect each individual day’s action - the adage that Candles are governed by "yesterdays close to todays open" does not sit well with me....

Cheers..
DrB.
 
ASF Members….

Just a short note from me to say that I am getting out of all aspects of Share Trading and the ASX World…

I have finished selling every stock that I held…. Yesterday I finished backing up copies of everything, and I have now removed all traces of anything related to shares & the ASX from my computers and placed all that data on an easily accessible External Drive…

I retired from the workforce at age 45, just because I could… been Share Trading for the past 32 years…. It’s now time to RETIRE….

My thanks to everyone for the interesting ASF ride.….

Good Luck & Goodbye…

Dr.B

15/11/24
Enjoy your retirement @DrBourse

gg
 
Sorry folks – I cannot remain quite when it comes to CSL…

I know that nobody in the Main Room believed my previous calls on CSL (Early Feb 2023, and again from June 2023 – Nov 2023), and most punters rubbished my TA - so I’m not sure if I should butt in again, or just sit quietly and watch..

Firstly – Current CSL Financials rate as “AVERAGE”.

Next - CSL Financials have never been rated as Good or Very Good since their inception.

Next – There are so many “Technical & Financial Signals” that suggest “Downtrend”, that it would take me too long to list them all…

Next – CSL Half Yearly Guidance of 10-13% probably indicates a SP of abt $280+/-, and will not result in the $350+ Analyst Guesstimates - CSL don’t really need the endless Analysts ramping of $350+, but then again they must have their reasons for those calls, unfortunately those reasons usually have nothing to do with Financial or Technical Analysis.

Next - CSL Hierarchy issue limited, useless, and unconvincing announcements that are usually of the Foot’n’Mouth variety…

As you probably know, CSL is not a Fav of mine, But CSL is a good stock to trade when/if you know what you’re doing..

For the sake of any Newbies & Lemmings that blindly follow “Analysts Blurb”, I hope I’m wrong this time..

Cheers
 
Todays useless bit of info.
“It is not uncommon to see a single share, or a very small number of shares traded – that is, 1, 2, 3, etc shares in the order flow.
Many years ago, brokers (or other evil institutions), were signalling each other, presumably about future price moves. Check out some of the seedier parts of the interweb and you’ll probably find some even more interesting theories.

In today’s environment there are two main reasons why a single share, or a very small number of trades occur.

Firstly, single share trades can occur because a single order has been split up over multiple price points. For example, someone might want to purchase 100 shares of the stock and when they place their order at market, there at 99 shares available at the first available price, e.g. 45.5c, and then the remainder of the order – 1 share – is filled at the next available price of 46c. Simple.

Secondly, and more commonly, single share trades are a product of brokers that use algorithmic trading engines (algos) to trade large parcels of shares over a single, or even multiple, trading sessions.

Imagine you are a broker and a client comes to you wanting to sell 10,000 units of a low liquidity stock. If you go and dump that order in the market, you will smash the price. Your order will keep slipping down further and further to the ever-lower available prices. That is where the term ‘slippage’ comes from. Worse still, you will be signalling to the market what you are doing.

To avoid all of this, an algo will break up the order into many smaller parts – often as little as a single share – to avoid detection. It will then trade those smaller parcels over the session(s) either when demand is available, at different price points, or in time increments – e.g. maybe every five minutes.

This is why sometimes you will see buy and sell orders of the same amount in the order flow – i.e. you might see parcels of a random number of shares – 317 for example – up and down one side of the order book, at multiple price points. This is a tell-tale sign of a larger order being broken up.
Aside from not wanting to smash the price and get a ‘bad fill’ for a client, some brokers/institutions also run algos that hunt for patterns in the market and try to take advantage of these broken-up orders.
Think of it as if you have a person/broker on one side wanting to sell a large chunk of shares and other people/market participants on the other side trying to capitalise on that movement. Now inject computers and the ability to recognise patterns and make decisions in a split second to take advantage of such price movements.​


The fight isn’t amongst people anymore, it’s amongst corporations with the fastest computing power, closest access to the exchanges, the best data scientists, mathematicians and string theorists. And if you think I am making this stuff up, I’m not. Read Michael Lewis’ Flash Boys and Gregory Zuckerman’s The Man Who Solved the Market”…
 
Last edited:
Top