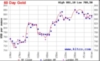
I am a relative newcomer and I have been using a system which uses MACD crossovers + price/volume changes to search for stock. I then use a chart that includes MACD + histogram and Twiggs Money Flow + ROC to choose when to buy and sell. [Twiggs is a modified Chaikin Money Flow]. The signals are a simultaneous rise in Twiggs and ROC + a change in histogram trend (or MACD crossover) for Buy Signal and simultaneous Falls + change in histogram trend for the sell signal. (See chart) I would be interested in any comments you may have on this system. The MACD crossover is generally too late as a signal - hence the use of the histogram trend.
Multicollinearity is reduced with this system as:-
ROC(price) is a momentum indicator
MACD is a trend indicator
Twiggs Money Flow is a Volume Indicator
The system is not mechanical but requires interpretation using the top display.
I use a filter (MACD + Volume and Price changes) to select potential stocks and then use the display to narrow down the choice and further information to buy and sell. It is a short-term system (5 to 10 days or more).