- Joined
- 23 September 2008
- Posts
- 919
- Reactions
- 174
Re: XAO Analysis
Right, it all depends on time scales your interested in trading with. However, smaller degrees will help confirm the larger degrees you're interested in. Hourly charts give a wealth of info and most chart packages let you see a fair bit of data. Also, I find changing the view to a line v's bar chart can provide more clarity on the patterns forming.
Not sure it's pointless tech/a, because surely while the lower degree waves are guided by the higher degree, they can forewarn (especially when corroberated by other analysis) of any deviation from the most likely path... but again I suppose it depends on the time frame one trades.
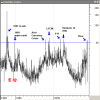
I monitor my stocks and indicies hourly as well for entry and exit points but don't normally count EW hourly... just as an example the hourly of the XAO looks likely to come back a bit more from here... supported by other indicators and charts not shown... pending later developments that may sway it.
PS: tech/a, I'm curious... I see you have a 3 in green box at top of chart. Did you start that five count from the Aug low and if so why?
Right, it all depends on time scales your interested in trading with. However, smaller degrees will help confirm the larger degrees you're interested in. Hourly charts give a wealth of info and most chart packages let you see a fair bit of data. Also, I find changing the view to a line v's bar chart can provide more clarity on the patterns forming.

