Australian (ASX) Stock Market Forum

WDS - Woodside Energy Group

good luck , with that

i am just happy i am in profit on them ( currently )

will i sell/reduce over say , $42 , i guess i will wait and watch first
Bought and sold in the comsec acc quite well the last few years but the 2010 freehold ones (sold the majority at around $50) stayed on the Westpac acc for all this time. (hate selling at a loss.)
 
SOME fund managers will be obliged to sell the new WDS entitlement
and some may make the decision to sell into liquidity

AFI, the biggest LIC on the ASX, puts out a Top 25 holders every month

29 Apr '22 : Rank #2 - BHP $668 miilion ; rank #25 - WPL $103 million
31 May '22 : Rank #3 - BHP $621 million ; rank #25 - BXB $101 million, and WDS nowhere to be seen ..... So I would guess, seeing WDS price , they sold a whole bunch, and some BHP as well. Nice AFI dividend in Aug !!.
 
(hate selling at a loss.)
so do i , i didn't really get started in the markets until 2011 and was slow to buy oil/gas stocks as i don't understand the industry as well as some , so bought WPL in the down-trend ( but unfortunately not the bottom ) but had excellent luck in Linc Energy and BPT made up for the disappointments in WPL/WDS and maybe TEG is finally coming good

as far as i am concerned WDS with have to prove they have lifted their game , not just inherited more projects that miss targets
 
and some may make the decision to sell into liquidity

AFI, the biggest LIC on the ASX, puts out a Top 25 holders every month

29 Apr '22 : Rank #2 - BHP $668 miilion ; rank #25 - WPL $103 million
31 May '22 : Rank #3 - BHP $621 million ; rank #25 - BXB $101 million, and WDS nowhere to be seen ..... So I would guess, seeing WDS price , they sold a whole bunch, and some BHP as well. Nice AFI dividend in Aug !!.
did they sell or has the change of ticker code/merger messed up the calculations , but yes AFI was the LIC that caught my eye on this

i will be watching the rivals as well
 
Oil up again overnight to US $122.41 bbl +2.51%

P.S. Still reckon oil is headed to US $150+ over the coming month's imo
 
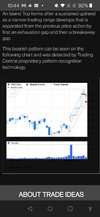
Woodside Energy Group Ltd forms bearish "Island Top" chart pattern
Jun 10, 2022

Trading Central has detected an "Island Top" chart pattern formed on Woodside Energy Group Ltd (WDS:ASX). This bearish signal indicates that the stock price may fall from the close of 34.82.

Tells Me: The recent rally has reached a top, signaling a (minor) reversal to the downside.

An Island Top forms after a sustained uptrend as a narrow trading range develops that is separated from the previous price action by first an exhaustion gap and then a breakaway gap.

This bearish pattern can be seen on the following chart and was detected by Trading Central proprietary pattern recognition technology.

*courtesy of Bell Direct
Thanks @Telamelo .

There are some brokers who have rich Australian and Overseas fund clients, and also, the poor of Australia, The new Gen traders, people on hotcopper and others on much medication, new to investing and trading.

Now I would never say this about Bell Direct.

So there is some conflict between the need of these brokers to satisfy large fund managers here and overseas when a kerfuffle such as the BHP/WDS fandango occurs, at a good price, doubly so if your fund is either pure ( as in ethical ) or sensible as in most of the robber baronies out there.

Now I would never say this about Bell Direct.

So if you are an overseas fund needing to rejig your portfolio after this godsent event to members of ASF, you may need to buy or sell WDS to rebalance your portfolio. This is not simple as few are selling atm. and the vagaries of the USD/AUD make timing a buy for US funds not easy. There is little that can be done to influence the USD/AUD unless you are a central banker or a President or Czar. So it thus remains to the market to enable these funds to buy, in this case, more WDS usually to balance their holdings.

But what is one to do if one is a broker or has a relationship with a larger broker overseas and there are few WDS available, and the AUD is rising or falling? Possibly suggest to one's "poorer" customers ( or are they clients ) , that having raked the leaves on one of many TA strategies it is time to sell WDS. Not in as many words though. As one does, one could just say. "It looks toppy" . If one is a hotcopperite, a Gen or on much medication.

Now I would never say this about Bell Direct.

So, I haven't looked at the chart WDS as I'm not actively trading/investing just getting rid of some June stayers but not gainers, and it may very well be true what you say.

Now I would never say this about Bell Direct.

gg
I receive daily Bell Direct e-mails/alerts such as their "trading ideas" that I thought of sharing regarding WDS (screenshot below)
 

Attachments

  • Screenshot_20220611-104428.jpg
    Screenshot_20220611-104428.jpg
    128.3 KB · Views: 23
I receive daily Bell Direct e-mails/alerts such as their "trading ideas" that I thought of sharing regarding WDS (screenshot below)
It's a long time since I did my Diploma in TA through ATAA and the SIA but that does not look like an island top. One could say at a stretch that the gap up in late Feb early March was, but my understanding is a number of 3 + bars forms an island above a gap.

The gap on Thursday has just about been filled with one bar albeit on low volume on Friday. Bell Potter and Trading Central may be correct but then again may be incorrect in their interpretation. Each to his own in TA. I'd never call an island top unless there was an island not just one coconut looking for a hint of sand in the ocean.

Trading Central I am not familiar with except by mention occasionally here.

There are so many bloody patterns now, cup n handle, shoes n socks, Amber n Johnny, it is difficult for me to keep up with them all.

And no, I will not draw an Amber n Johnny set up. Here's a chart of WDS to illustrate what I mean. The circle on the left is an island top, just.

WDS.png


gg
 
gg we are heading into winter, so they must be coming in to summer?
Thanks @Austwide . I was referring to their winter re price of oil but possible should have said "summer and winter".

Nothing much happens when the sun shines in Europe re oil and gas for consumers was my point. Now winter is a different thing.

They have even forgotten how to knit.

gg
 
Thanks @Austwide . I was referring to their winter re price of oil but possible should have said "summer and winter".

Nothing much happens when the sun shines in Europe re oil and gas for consumers was my point. Now winter is a different thing.

gg
there is an observable driving season effect in USA, though $5 a gallon into the SUV is going to be expensive. And I remember 50km+ of campervans side to side from St Malo to Mont-Saint-Michel , mainly NL and D, one July.

 
there is an observable driving season effect in USA, though $5 a gallon into the SUV is going to be expensive. And I remember 50km+ of campervans side to side from St Malo to Mont-Saint-Michel , mainly NL and D, one July.

I would agree re driving effect.

Although some unfortunate tourist filling up does not attract as many clicks on the Daily Mail site as a pensioner found dead, frozen in some tower in Hackney holding on to an extinguished candle.

gg
 
Woodside Energy Group Ltd forms bearish "Diamond Top" chart pattern
Jul 01, 2022

Bell Direct Trading Central has detected a bearish "Diamond Top" chart pattern formed on Woodside Energy Group Ltd (WDS:ASX).

This bearish signal indicates that the stock price may fall from yesterday's close of $30.45 to the range of $22.75 - $24.25.

The pattern formed over 79 days which is roughly the period of time in which the target price range may be achieved, according to standard principles of technical analysis.

The price seems to have reached a top, showing signs of reversal as it has broken downward after a period of uncertainty or consolidation.
 
Top