Australian (ASX) Stock Market Forum

Roller's Intraday futures journey

Joined
13 September 2013
Posts
988
Reactions
530
Hi Guys

I have decided to start my own journal while I attempt my own intraday discretionary futures trading Journey.

I am focusing on the Nikkei at this stage due to the similar time zone that the day session has with us. It is not practical for me to be trading at night or into the late evening. Trying to get 2-3 days a week in but i'll be checking the charts everyday obviously.

Over probably the last five years I have predominantly focused on systematic stock systems. While I will continue to trade them on the ASX and the US markets I have an itch that I need to try and scratch in regards to future trading.

After also following @Modest journey in his journal and also exchanging emails with @captain black I have decided to take the plunge. At the start of the year I paper traded for a few months but life got in the way. I am back sim trading and will do this until I feel more confident.

I will mainly be throwing some charts up on this thread and some possible ideas I have in regards to trades. i'm keeping amore detailed journal in onenote for myself, i'll try and keep this thread updated. Hopefully a few people follow along and share something insights. My focus is on support/resistance areas incorporating multiple time frames
 
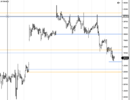
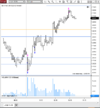
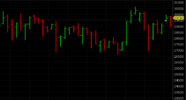
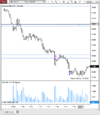
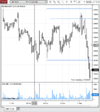
This is the current 60 chart of the Nikkei with some areas of interest marked up. These gaps have thrown me a bit the last week and made the chart a bit messy. I've been focusing on shorts the last few sessions waiting to fill these gaps.

1636520839963.png

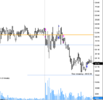
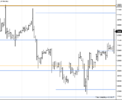
Just a couple of trades today got stopped on the high of the day, was probably not an ideal stop placement and the second my target was missed by a tick when i had to duck out of the house for 30 mins, i ended up closing the position after some short term strength came in

1636521176953.png
 
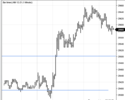
We filled the gaps overnight and could get a nice push up from here.

I tried a long early before cash open but got stopped out. I find it hard first thing in the morning with big swings and trying to get good stop placements. Already getting a big push up. Hopefully wait for a pull back to enter.


1636588747442.png


1636589699889.png
 
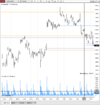
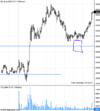
Got the nice push up i was looking for and a pull back to enter. I wa getting nervous after the entry with some low closes on the 5 min bars.

Target got hit which i thought it could be conservative. Over all i think price might go to 29500 before a decent reversal.

1636600061957.png
 
Last edited:
Could talk all day on Index futures. (Well Technically)
I trade the DAX--not as much these days as Im so busy and tiered at night
and dont neeeed to.
But i do notice a lot of re occurring technical indications in charts. To be honest
I Haven't re searched if they are common to all index futures charts. They are
common in analysis principals though.

EG
Sharp moves with Shallow consolidations tend to continue.(The consolidation after your move is boarder line to me)
Hook bars on High/Low Tests tend to indicate reversals. (See the bottom of the chart you posted above)
Long bases tend to hold (In your consolidation)
Blasts through Resistance or Support tend to not be revisited soon.

Interested if you observe similar.

And more but later.
 
Was waiting for a retest of 29500 but not there yet.

Got the pull back but was waiting for a push down with some volume into the blue box. Might be a tradeless day, not worried about P/L too much at this stage just getting a feel for things. I have to head to work after lunch, be interesting too see what happens after the lunchbreak in Tokyo 2pm SA time

1636681549382.png
 
EG
Sharp moves with Shallow consolidations tend to continue.(The consolidation after your move is boarder line to me)
Hook bars on High/Low Tests tend to indicate reversals. (See the bottom of the chart you posted above)
Long bases tend to hold (In your consolidation)
Blasts through Resistance or Support tend to not be revisited soon.

Interested if you observe similar.

Will be interesting if i do.

I'm trying to to get married to any patterns/observation i have at the moment, i'm still very new to this style but will see how i go.
 
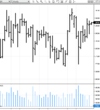
Does anyone have any idea why my weekly charts (and daily) are different in ninja trader compared to IB? I am using data from IB in ninja trader so it must be the start times/end times I guess?

1636765732238.png


1636765682511.png
 
It has been a long time since I used NT (was probably still NT7). But I do remember this problem. At the time, NT used your system clock when creating the bars, which didn't match whatever IB uses to display their data. There might be an option to set market trading hours. I just did a very quick google search, see if this helps at all:


Nice work on starting the thread by the way. Best of luck on your new journey.
 
Nothing much in the way to 29750-840 possibly, a big move though i think?. Was waiting for a retest of 29500 but not there yet.

The high this morning was 29850 wasn't watching but i pretty slow day after that.

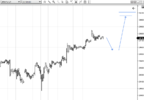
Possibly a pull back towards 29500 before a run up to the next level around 30060-110, if the up trend continues. I won't be trading tomorrow but watching from afar.

1636970297642.png
 
It has been a long time since I used NT (was probably still NT7). But I do remember this problem. At the time, NT used your system clock when creating the bars, which didn't match whatever IB uses to display their data. There might be an option to set market trading hours. I just did a very quick google search, see if this helps at all:


Nice work on starting the thread by the way. Best of luck on your new journey.

Thanks, I will contact support and see what they say. I have adjusted some options so that might help if I reload new ones
 
I Put a few trades on early today, both were losers. But for some reason my ninja trader is playing up so I will be trying to sort that out. I think trying to fix something messed something else up... :banghead:
 
Back at the charts today after being away last week.

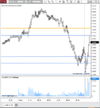
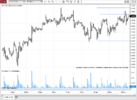
Important area at the top of this zone I think. It is looking like price is going to open around the 29680 area, basically the bottom of that last down bar.

Let's see what today brings

1637710859296.png
 
Pretty rough day for the Nikkei. I finally got my data issue sorted out… I think. It wasn't until lunchtime though. I will say that ninja trade support are very good, especially since I'm only using the free version. quick on the replies and seem happy to help.

Originally I thought if the short was on, it would end up around 29,400 mark but it blasted through that pretty well.

I only put one trade for the day a retest of a previous area I had identified. Hindsight says i got in early and just missed my stop but that's ok for now. +120 points

Because I had to reinstall NT last week, I didn't set the point value/tick sizes up right. Apparently this one trade got me 12 K… I think I need to readjust that :p also had to reset my Sim balance, but that hasn't moved much at all.

1637732428515.png

1637732077402.png
 
Top