Australian (ASX) Stock Market Forum

Roller's Intraday futures journey

Remember the fractility of the markets. Everything I am talking about here works in all liquid markets on all timeframes.

Also, not all of these setups will work. Some will never reach the zones you have marked, some will take off without you - doesn't matter. If the markets are fractal, which they are, there are more setups across all timeframes than you could ever take.

The most important thing is patience and a framework to mark up your charts and wait for your setups to present themselves. Don't force the trades.

Thanks, that is one of the main things I need to work on not spraying trades all over the place because I can on a similar account. I need to wait for logical setups in logical places.

Well that is one of the things anyway :p
 
I learn't everything from MENTFX on his free YouTube videos. It's a great source of knowledge. It's basically based on smart money concepts, where liquidity lies in the market that the composite man would target, supply and demand zones, etc.

This guy is intense! lol Quick mouth on him. But videos are looking like they'll be good, thanks for the heads up. Tradingview looks nice too! Is that all you use?
 
This guy is intense! lol Quick mouth on him. But videos are looking like they'll be good, thanks for the heads up. Tradingview looks nice too! Is that all you use?
Hahaha! Yeah, he is funny! But man, he has excellent content. As I said - I learnt to trade smart money concepts soley from him - from his free videos. Which is ridiculous that that kind of content is out there for free!

Yep, the free version of trading view is all I use. I am thinking about upgrading to 'Pro' which is $14.95 USD per month so I can have some more alerts (you can only place 1 alert with the free version). But, yeah, thats it.

In all aspects of my trading, I find that less is more. :)

Great i'll keep watching some. Then are you placing trades using CFDs?

Still short from 27840, very choppy last few hours. cue upside rip..

1638417471457.png
 
Yep, the free version of trading view is all I use. I am thinking about upgrading to 'Pro' which is $14.95 USD per month so I can have some more alerts (you can only place 1 alert with the free version). But, yeah, thats it.
I have used it to look at some prices of crypto before, but haven't really thought about it for the Nikkei. The replay feature is nice. I might have a play around with that too
 
I just realised my data/chart didn't match yours when you posted the chart with the large up bar. Had to find the right ticker. Think I have it now.

RhKXo9Ug
 
stop hunt?
It's a liquidity grab. The ranging isn't coincidental.

The 'composite man' is building a range which is putting in points where people think they can either put their stops above and go short or buy stops to go long, or put their stops below to go long or their sell stops to go short - but what retail traders don't realise is, they are right in the middle of all of the 'chop'. They are just looking for any excuse to get into a trade and then BOOM - composite man runs those points to pick up all the liquidity and then move the market to where they want it to go - and retail traders are back on the beginners cycle wondering where they went wrong and looking for a strategy change.

JZfaMEOn
 
It's a liquidity grab. The ranging isn't coincidental.

The 'composite man' is building a range which is putting in points where people think they can either put their stops and go short, or buy stops to go long - but what retail traders don't realise is, is they are right in the middle of all of the 'chop'. They are just looking for any excuse to get in and then BOOM - composite man runs those points to pick up all the liquidity and then move the market to where they want it to go.

JZfaMEOn

Yep, i like that. Cheers

It was one of those things, leave the stop where I had it out of the days range or is price and shoot up straight above the high? Will be interesting what happens in the coming sessions and over the rest of today
 
It's a liquidity grab. The ranging isn't coincidental.

The 'composite man' is building a range which is putting in points where people think they can either put their stops above and go short or buy stops to go long, or put their stops below to go long or their sell stops to go short - but what retail traders don't realise is, they are right in the middle of all of the 'chop'. They are just looking for any excuse to get into a trade and then BOOM - composite man runs those points to pick up all the liquidity and then move the market to where they want it to go - and retail traders are back on the beginners cycle wondering where they went wrong and looking for a strategy change.

JZfaMEOn

My basic thinking this morning was something along the lines of this.

Where price turned overnight wasn't a significant level I was thinking. After the relative ease that price went through the old support areas and the 850 zone I was looking for a test of this before it headed back down to test the larger timeframe trading range support. If you zoom in on the 850 zone on a smaller timeframe you can see some consolidation there before a quick drop overnight. My thinking was this could be a point of supply inbalance like you have been pointing out. Test this area and then chop its way down to the bottom of the larger timeframe range for another go at heading back up.

But I guess you can't really predict, just have to play out what happens and have a bit of a plan either way.

1638421924797.png
 
I'm going to be honest because I really want to help.

When I stopped thinking in terms of retail trader support and resistance and these chart patterns like triangles and what not, the way I viewed the markets just completely changed. I literally draw nothing on my charts anymore except some boxes for supply and demand zones and a few horizontal lines to mark targets and invalidation points.

The second thing that really helped me which I have only really started to grasp the astonishing benefits of is market fractility. Just remember if something isn't clear on the timeframe your looking at and you need more data, go lower. If there is too much noise on your chart if you're trying to work out a level, go higher - less bars.

I have only realised recently how crazy it is for people to say 'Oh, I only trade off the 60 minute chart'. Well, what the hell do you do if something is unclear and you need further breakdown... lower timeframe charts of course.

Let me show you an example (sorry for clogging up your thread)

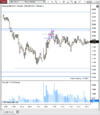
In the chart below if I asked people why did the impulsive down move stop at around 27455, people would say 'Oh, it's because there is support to the left. Nope, wrong.

vx3It1bt


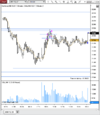
I'm literally looking at that 60 minute chart thinking I have no clue why it stopped where it did, I can't tell. I need more data. Lower timeframe. 15 minute. Let's go.

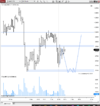
Anton explains it much better in his videos than I can explain here but hopefully my chart markup below can offer some guidance.

rAsKtbPq
 
Last edited:
Mate this is some good stuff, thanks for all that! And it does make sense too. I'm going to have to do digests this for a bit and do some study on the charts. More info the better, don't worry about clogging up the thread.

is that BoS; Break of Structure?

I am definitely guilty of having charts get out of control with lines everywhere, adding to the confusion of everything. Like you said is just all noise.

Modest posted a good book in his thread a few weeks ago about different timeframe analysis. I'm going to check that out soon, not sure if you have read it? Like he has said a lot, turning points and accumulation and distribution take time to happen, just because it look like it reversed on a dime on the 60 minute chart there is going to be clues on the 1, 3, 5 mn charts.
 
Top