- Joined
- 13 February 2006
- Posts
- 5,056
- Reactions
- 11,454
That is the one. Energy majors basically.
jog on
duc

Full story: https://www.wsj.com/business/energy...h9r8eera51b&reflink=desktopwebshare_permalink
jog on
duc
That is the one. Energy majors basically.
jog on
duc

awesome , eventually it will become a new water capture ( lake/marsh ) area and encourage new plant growth ( as one might suspect it was in prehistoric times )



| The ISM Manufacturing PMI has been below 50 for 17 out of the last 18 months. |
| The ISM Services PMI moved below 50 in April for the first time since December 2022. |
| Since 2008, the only periods when both PMIs have been below 50 at the same time: |
|
| 11) A Few Interesting Stats… |
| a) US Stock Market Capitalization as % of GDP… |
|











|
|



|
|


Some well-known bears are back in the news, with their usual dour predictions, from a recession coming soon to an outright 65% market crash. You can read more about their calls here, but we’ve been hearing these same things for years now and been pushing back the whole time. To be honest, I’m glad to see these permabears still pumping out the same old story, as I’d be much more worried if they looked at the data and come to a bullish conclusion.Even a broken clock is right twice a day.”


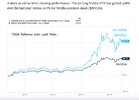


Learning difference eft vs index is quite interesting..and indeed can make an unexpected difference...a small cost for better diversification/safety..bug do you want diversification when purchasing such focussed ETF?From Carson Research:
Some well-known bears are back in the news, with their usual dour predictions, from a recession coming soon to an outright 65% market crash. You can read more about their calls here, but we’ve been hearing these same things for years now and been pushing back the whole time. To be honest, I’m glad to see these permabears still pumping out the same old story, as I’d be much more worried if they looked at the data and come to a bullish conclusion.
We can talk all we want about the path of the economy, inflation, the election, geopolitics, or what the Fed should or shouldn’t do, but what matters at the end of the day is what markets do. Here are a few things I’ve noticed recently that continue to suggest this bull market is alive and well and a summer rally is still likely. For more on this, be sure to read Six Reasons This Bull Market is Alive and Well.
Breadth Is Strong
If more and more stocks are making 52-week highs, that’s a good thing. It suggests the foundation of the bullish move is healthy and likely sustainable. Below we show that is happening across the board.
View attachment 176916
One of my favorite technical indicators is advance/decline (A/D) lines. These are simply a daily look at how many stocks go up versus down each day on various exchanges. When A/D lines are breaking out to new highs, it could be a clue that overall price is about to follow. The same could be said for new lows in A/D lines, which means there’s weakness under the surface.
Last week saw new highs in these A/D lines: S&P 500, NYSE, and Midcaps. Small caps are close to a new 52-week high. To keep it very simple, this isn’t something you see in a bear market and it means this early spring rally likely has legs.
View attachment 176917
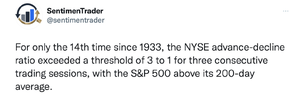
Lastly on breadth, there was a buying thrust on the NYSE that tends to be very rare, but quite bullish. For three days in a row more than 74% of the stocks on the NYSE were higher on the day. It is normal to see this for a day or two, but three days is very unusual and it suggests heavy buying pressure taking place. We found this happened only eight other times since 2000. A year later the S&P 500 was higher every time and up close to 23% on average.
View attachment 176918
Stocks Don’t Peak in March
The last time the S&P 500 hit a new high was March 28, which lead to the 5.5% mild correction into mid-April. We were on record the whole time that it likely wouldn’t turn into a 10% correction (or worse) and with the big rally the past three weeks, that is looking accurate. I looked at the past 38 corrections and bear markets since World War II and I found that only once did one start in March. That of course was March 2000 when the tech bubble burst. But the bottom line is it’s quite rare to see stocks peak in March and this time doesn’t appear to be any different.
View attachment 176919
Better Inflation Data Coming
We’ve talked a lot about why the recent blip in inflation to start this year was probably nothing more than some pain after the large improvement in the past year and seasonal quirks (like higher auto insurance and higher financial services fees), and that we expect to see things like shelter drastically improve over the coming months. Here’s another interesting development that shows used car prices have outright tanked, even though the government’s data doesn’t show this yet.
From Thrasher Analytics:
The utilities sector is highly sensitive to interest rates, and we recently saw XLU start to lead as the market recovered after bottoming on April 16 and the 10-yr Treasury yield hit 4.66%. The yield inched slightly higher but mostly been moving lower during this period of XLU strength. At this point, utilities are one of the only sectors seeing a big move in stocks with stretched momentum, a unique development we don’t see very often.
Below is a look at the percent of each sector that is “overbought” based on a 14-day RSI rising above70. Nearly all sectors are between 0% and 14% except for one. Utilities stands out like a sore thumb at 46.7% at Friday’s close. It would be one thing if we saw a general consensus among sectors of elevated momentum in individual stocks, but when one sector stands alone, it’s at a higher risk of reversing as flows shift to less stretched corners of the market.
View attachment 176920
Thanks for reading Thrasher Analytics Substack! Subscribe for free to receive new posts.
Subscribe
Looking closer at the momentum breadth data for the utilities sector, below is the percent of XLU that is “overbought” or “oversold.” On Thursday, 60% of the sector had its RSI rise above 70, becoming “overbought.” When we breach 50%, XLU has soon begun to struggle to continue to advance and often reverses lower, as shown by the red dots are the chart below.
View attachment 176921
ETF's generally:
Today’s post isn’t long, but it’s important.
We’ve been seeing some posts floating around on social media about how the Utilities are the best-performing S&P 500 sector in 2024, and we feel like that needs to be addressed.
The Utes have done well this year, but they are NOT #1.
Communication Services is still out front, and by a fairly wide margin. Here’s the year-to-date S&P 500 sector performance derby:
View attachment 176922
So what’s causing the confusion? Are people just that ill-informed? Or is there something else going on?
The problem can be traced to the difference between following the market and following an ETF that attempts to track the market.
As a general rule, we try to always use indexes at Grindstone. We want to analyze the market in its purest form - not one that’s been diluted by fees or the decisions of individual managers - and then we can look for the best vehicle to use afterward.
Usually their isn’t much distinction between our analysis and that of those using funds to track sector or industry performance. This year, however, the popular SPDR Sector ETFs have done an especially poor job of reflecting the true market action. As a result, XLU, the Utilities ETF, has outperformed all the other sector ETFs.
Take a look at what’s happened. The Communication Services ETF (XLC) has lagged the sector index by 6%. The Information Technology ETF (XLK) has understated the sector’s performance by almost 5%. And XLY has underperformed the Consumer Discretionary sector by 3%.
View attachment 176923
How did that happen? It’s not that State Street dropped the ball. Their ETFs did exactly what they were designed to do and they’ve tracked their benchmarks admirably. The problem is that their benchmarks aren’t what most people think they are.
The S&P 500 is a market cap weighted index, meaning the largest stocks are the most important. The sector indexes are the same way - each stock’s importance within the sector is directly related to the market capitalization of the stock.
The select sector ETFs use what’s called a Modified Market Cap Weighting. That ‘modification’ keeps any single company from exceeding a 25% weight in the fund and keeps the sum of all companies with weights greater than 4.8% from exceeding 50% of the total. Here’s a summary of their process for reducing the weights of companies that violate their modified market cap thresholds:
These rules are causing BIG distortions.
- If any company has a float-adjusted market cap weight (FMC) greater than 24%, the company’s weight is capped at 23%, which allows for a 2% buffer. This buffer is meant to mitigate against any company exceeding 25% as of the quarter-end diversification requirement date.
- All excess weight is proportionally redistributed to all uncapped companies within the relevant index.
- After this redistribution, if the FMC weight of any other company breaches 23%, the process is repeated iteratively until no company breaches the 23% weight cap.
- The sum of the companies with weights greater than 4.8% cannot exceed 50% of the total index weight. These caps are set to allow for a buffer below the 5% limit. If this rule is breached, rank all companies in descending order by FMC weight, and reduce the weight of the smallest company whose weight is greater than 4.8% that causes the breach to 4.5%. This process continues iteratively until the rule is satisfied.
Let’s briefly walk through Communications. Alphabet’s market cap share of the Communication Services sector going into the quarterly rebalance stood north of 40%. But since the weight is capped at 23% in the ETF, that means the ETF only gets about half of the GOOGL weight it’s supposed to. Meta was north of 25%, too. Result? Underweight META. Put those two together and you’re at a 46% weight for the ETF, a little more than 20% below what their true market cap share is. Now we have to distribute that 20-odd percent across the remaining 17 companies in the sector, which pushes another 6 companies above a 4.8% weight.
Except GOOGL and META are already at 46%, and adding any company at more than a 4.8% will violate the 50% cap in rule 4. So each of those 6 companies is iteratively reduced to a weight 4.5%. It’s a messy process that effectively overweights each of the smallest companies in the sector and underweights the largest.
There’s also a large distortion for the Tech sector. Microsoft and Apple were the two largest stocks in the sector at quarter end, and neither were in breach of the 24% market cap share threshold. So far, so good. But then add in NVIDIA, at about a 17% weight, and you’ve got a problem. Since the 3 together represent 60%, rule 4 is broken. To correct that, “reduce the weight of the smallest company whose weight is greater than 4.8% that causes the breach to 4.5%.” So the weights of MSFT and AAPL aren’t changed, but NVDA goes from a 17% weight to a 4.5% weight.
NVIDIA is the second-best stock in the entire S&P 500 so far in 2024, yet XLK is underweight the stock by 12%. No wonder we’ve got performance distortions.
We’re not here to bash the ETFs - these modifications could have resulted in outperformance of the true market just as easily as they have underperformance. All we’re saying is that it’s important to know what you own.
That’s all for today.
Copper:
View attachment 176905View attachment 176904View attachment 176915
View attachment 176914
I hold PBR. So this morning when I checked, wow. Called for a rapid infusion of coffee. I added to my position. Bleh.
View attachment 176913
View attachment 176912
Sure with massive inflation the only realistic outcome, why would you buy UST paper?
View attachment 176911
Horrible. No recovery in sight for 20yrs.
View attachment 176910
There are a few more out there. TSLA is one. Avoid.
View attachment 176909
I would have been interested to see from say 1974 to today. The size of BRK-A just makes outperformance tough. But interesting to know that if you were just starting out, the way to go is just via SPY. So easy. A bit spicier QQQ.
View attachment 176908
Just keeps that permanent bid under stock prices. Price insensitive, they are buying back stock so that the massive Options grants to management do not dilute the stock.
View attachment 176907
Compounding at work. The sovereign debt bubble will blow-the-f*ck-up. 100% certain. The issue, as it was with the housing market in 2007-2008, the powers that be are actively fighting against this. They are kicking every can they can find down the road. They will likely succeed for a time. This makes the inevitable difficult to time. You'll know it when you see it.
View attachment 176906
Not a good look.
pg. 2
Hello and welcome to Aussie Stock Forums!
To gain full access you must register. Registration is free and takes only a few seconds to complete.
Already a member? Log in here.