Australian (ASX) Stock Market Forum

New analysis technologies

Timmy

white swans need love too
Joined
30 September 2007
Posts
3,457
Reactions
3
What do you think about the value of utilising new technology in your analysis? It’s easy to accept the value of new technology on the execution side, imagine a world without internet brokers…but what about the new technologies in analysis?

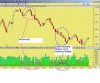
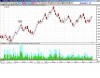
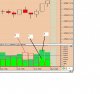
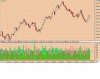
Is an OHLC bar or candlestick that updates every “x" minutes the best of analysis technology for traders using technical analysis? Does anyone see value in using constant volume bars, range bars, change bars, market profile, footprint charts, tick charts? Can any of these improve existing analysis, or add new, more valuable forms of analysis to your toolkit? As an aside, does using these show up some of the inadequacies in ASX reporting of time and sales and perhaps suggest that trading different markets than the ASX could be attractive?

Any thoughts?
 
constant volume bars, range bars, change bars, market profile, footprint charts, tick charts?

Absolutely---some already do and there is software available for some as well,infact most.
You can chart just about everything you mention.

OHLC will always be about the market auction couldnt function without it.
 
Thanks tech/a - yes the software to use other than time-based bars is out there, most I have seen are from the US, but would love to be corrected and see some from Australia/NZ.

Range, constant volume, tick, and change bars will all present the data in OHLC/Candle format (market profile doesn't and footprint does/doesn't depending on how you look at it) but don't rely on the OHLC of an "x" minute period to do so. Anyone using these alternatives?

I see great value in using some of these techniques to control one variable while allowing another to vary - for example, constant volume bars will print an OHLC/Candle bar every time "y" shares/contracts are traded - for example on the SPI there might be a case for using a bar that prints each time 500 contracts trade (just picking a number out of the air here), or on WBC printing a bar each time 25,000 shares trade, or whatever. In doing so, with volume held constant each price bar can be assessed as being "equal". Now this wouldn't work for your VSA analysis tech, but I wonder if using constant tick bars might be useful for VSA analysis - that is, print an OHLC/Candle bar each time "z" number of trades takes place, that way you would be holding the number of trades per bar constant while allowing price and volume to vary only. Could show up large volume interest vs. smaller volume interest, based on the assumption that large volume interest is "smarter" money than small volume interest (not always a safe assumption I know).

Anyway, I didn't start this thread to hear my own voice (keyboard...) be interested to hear from the community.
 
Think motorway uses Point and Figure sort of in this way.

I know exactly what you mean and have thought along similar lines.
I'll make some enquiries then get back to the thread.
 
Hi Tim

The mkt reality is seen in time and sales

What is that reality ( ticker tape )

How does charting that reality .. reveal somethings and make other things hidden ?

What is on the tape ?

Price , volume and time

That is the reality You want to discern changes of behaviour in...

To make that easier We use charts ( a one stock stock market, just the tape would be fine )

Ok What are We interested in , Profits ? Which can only come from movements in Price ?

Time passing on it's own = 0
Just Volume Churning = 0

So charts usually put Price on the Y axis

So what do We put on the X axis ?

either time , Volume or Price ........... ( or some combination = activity )

P,V & T have different attributes that can be charted


Price movements cut up into discrete units of time are linear charts
Price movements cut up into units of something else are non linear charts

To really monitor the reality of the tape

We need Both types of chart....

( The market reality is non linear by the way.... It DOES not have a fixed speed ... The old tickers sometimes went silent and sometimes could not keep up ...What matters happens at only particular times critical junctures
"turning points" of price volume and time....That happen before the new trends emerge )

on P&F


Why P&F is a Great Tool

As a trader, you have developed a set of tools that work for you. And let’s say that they work most of the time – except when the market goes flat and boring. How do you ignore flat and boring? Point & Figure! P&F is always active when the market is active, and does not register when the market is quiet. That is, only market movement beyond a certain noise level counts, making the filter non-linear. Additionally, many P&F chartists change their box heights depending on the price level, making it adaptive. Would you have ever expected Charles Dow to invent an adaptive non-linear smoother?

It gets better: P&F is asymmetric. As you are rising, you keep making x’s each time you achieve a new box level. But you don’t start a down column (making o’s) until the price goes down by your pre-determined reversal level (traditionally 3 boxes). That is, at a given point in an up move you only need 1 up-box to make another x, but 3 down-boxes to make an o. The combined effect of the noise filtration , adaption and asymmetry means that a a P&F trading tool should make you money. That helps to explain its popularity and longevity.

I don't agree with some of that
1) DOW did not invent them
2) Symmetrical charts are as if not more useful than asymmetric

however He is right..P&F By moving only when the market charted does.

Becomes a useful detector of certain forces at work

I once charted the same data as tick bars Volume bars and range bars
They tended to look not much different than P&F charts

And bought with them a negative characteristic that hid what is a
peculiar characteristic of P&F that is it's most useful
( It is not in the quote above but follows from it )

( This is congestion analysis )

Another similar chart is renko charts

If I understand what you mean by footprint ( Like a P&F with volume in the boxes These have been around since at least 1900 )

Normal bar charts don't have volume

volume is in a separate chart placed underneath

the key to understanding
is in the terms linear and non-linear

and that charts are only maps


motorway
 
Thanks Motorway, thats good stuff to think through for me. The sort of analysis I do is Wyckoff, mainly VSA but trying to integrate more of the congestion analysis side too...most (like 99%!) of the information on it I get from...you! Your postings here and elsewhere.

In addition I do some basic candlestick stuff, really basic and looking at what happened on the bar, and in the context of the wave, rather than labelling the bar.

What I am doing with some of these new presentations of the data (and like you say, thats all it is, the same data just cut up, wrapped, and presented differently) is to see if they can help me better understand the price and volume activity as opposed to using time-based bars and P&F ... that is, is this (presentation of the data) a better map?

I suppose at the end of this thread we will decide to use whatever presentation of the data suits each of us best, but I hope during the journey to that end we can tease out some pros and cons of using different maps.

I will come back with some more specifics tomorrow (actually I think it is tomorrow already), thanks tech and motorway for the input so far.
 
Timmy,Motorway

Do any of you or anyone else for that matter know where there is Market Profile/Steidelmayer software around?
Other than that which you pay a monthly lease?
 
tech, I have seen a couple that plot a market profile with excel. Must admit I haven't used any of them, not sure my excel skills are quite up to it, will try to hunt them down for you
 
Timmy I have one but was looking for something that is auto.
As it works best with 15 min data,although not only.Havent the time to hand plot.
 
Tech The Software I am using atm does market profile

They have an Esignal version coming out soon..

Tim interesting With these type of charts
even though time is not on an axis.... it is still part of the chart

If time was not ( We freeze time ) Then everything including postings to the chart would stop...

P&F for example it is said the boxes are woven ( or filled ) By Price Volume & Time. ( You need to think about how does a chart move what makes it move. Then You can work out how useful it would be )

Why use these types of charts ?

To better define position

To qualify the movement seen on a normal bar chart.

It is trend-lines that are esp different for example

On the bar chart it might only be the time axis that causes the break
or builds a base

P&F charts with log boxes are 100% adaptive
I doubt range bars volume bars can be as easily made as adaptive

A P&F 2% log chart is scalable across the whole market and across the whole
price range...

With P&F to go down to very small box sizes
You need intraday data

With all these types of chart You don't want time ( distortion or constraint )
creeping in....adaptive has to be totally adaptive


Here is something from a hedge fund

http://svquant.com/documents/ffm_paper_1998.pdf

motorway
 
Thanks Motorway. I wanted to hear your thoughts as I think some of these ways of cutting up and presenting the data could be very helpful with a Wyckoff approach to the analysis.

“Price movements cut up into discrete units of time are linear charts
Price movements cut up into units of something else are non linear charts

To really monitor the reality of the tape

We need Both types of chart....”

Now, this makes me wonder. I think the linear charts, those that track price by time, can be dispensed with… Let me rephrase that, as one of the charts I use still has time on the X axis, but not equal units of time, more bars form when the market is trading actively/heavily, than when it is not. Price is tracked according to units of volume that trade. These are the constant volume bar charts, example attached (each bar plots 10,000 contracts traded). The example shows the mini S&P500 on the CME with the transition from “overnight” trading, where it can take a long time to form bars, to RTH (regular trading hours – open at 00:30 NSW time Nov. 2, 2007), where a bar can form in seconds.

More to come ...
 

Attachments

  • asf 1.jpg
    asf 1.jpg
    106.5 KB · Views: 320
I think the closest to P&F charts are the range bars, where a new bar is begun after the price covers a certain price range. I wont go into the details, take too long, but a range bar chart doesn’t cut out any of the extreme prices that trade, like a P&F chart can, as it is designed to do.

The similarities are probably more important than the differences – like the P&F, the range bar chart only moves when the price moves, by a user-defined amount. It is not adaptive, in the sense that the range does not change as the absolute price changes, I imagine this could be done, but the jumps would be fairly large in this contract as it trades in discrete 0.25 of a point jumps.

I think that like a P&F the range bar chart is useful for congestion analysis, with the difference that it will show more price detail, whether this is an advantage or not is probably in how the trader uses the chart. Whether the range bar or P&F chart is generally more advantageous is again probably up to the individual trader, but the pros and cons are up for discussion.

I have attached a range bar from last night’s trading (Nov. 5, market open is now at 01:30 AEDST ). Range size is 1 point, whether this is appropriate or not is another discussion.

Yet to read that attached article, thanks for that.
 

Attachments

  • asf 2. jpg.jpg
    asf 2. jpg.jpg
    96.9 KB · Views: 319
The similarities are probably more important than the differences

Here is an important difference... The P&F chart is not forced to move sideways
It could be a continuous vertical column that simply pauses and resumes

This is what makes the congestion on a P&F chart significant ..

And for example trend line breaks significant..

Sideways is significant because moving sideways does not just follow naturally. It is not a given.... Something real ( that will have an effect ) makes the chart move sideways....

I think You will like that paper....

motorway
 
Now, this makes me wonder. I think the linear charts, those that track price by time, can be dispensed with

Here is some High level Wyckoff

What suffers the most by cutting the tape into units of time ?

Price and so the analysis of price
or Volume .........

Time separates what should be seen as one thing..

But it distorts one of these more than the other

motorway
 
The range bar only moves sideways when the price trades outside the defined range, not with the passage of time alone.

For the contract I have posted charts for I have set the range at 1.00 point, which is 4 tics of 0.25.

So, let's say a bar starts at a price of 1500.00, then trades:
1500.25
1500.50
1500.75
1500.50
1500.75
1500.25
1500.75
1501.00
1500.75

OK, so far the range on that bar is 1 point. Now, if we imagine the price trades between 1500.00 and 1501.00 for the rest of the day then no other bars will form, that is no other bars will be added to the chart, it will not move sideways, volume will be added to the one bar that is forming between 1500.00 and 1501.00, but no price bars will be added.

There will only be another bar start to form if the price trades outside of the range of 1500.00 or 1501.00. Let's say the next price that trades after 1500.75, the last price on the list just above, is 1501.25, this trade begins a new bar, NOT the passage of time.

I should have explained this more fully initially sorry.
 
What suffers the most by cutting the tape into units of time ?

Price and so the analysis of price
or Volume .........


Cutting the tape into units of time is, mostly, arbitrary. I say mostly because I believe the closing price each day is of significance and therefore the cutting of the tape at closing time is not arbitrary.

The "closing" price of a 5-minute bar though, for example, is not of significance, except in as much as it relates to the closing price 5 minutes ago and is therefore a regular sample.

Similarly, the cutting of the tape into units of volume is also arbitrary, same arguments go for cutting it by range, or whatever. The market, the price, is a continuum from open to close, and dissection must be arbitrary. However, we do it, and do it for good reason, to sample it, to compare, to make judgments, to assess risk and return.

However, by cutting the price into units of volume, one can compress periods of little activity (lunchtime market, for example, or Melbourne Cup day hehehehehe) into periods of equal volume, thus giving equality to the samples according to something that is significant - I think volumes are significant, compared to time passing.

So, back to the question you posed Motorway, what suffers/distorts more, price or volume, when the tape is cut into time periods, I would nominate my ability to analyse what the price is doing as suffering the most. For example, the up trend line that is broken by the steady march of sideways price, with little volume, is that a signal? Or the result of lunchtime? Or, is the price allowed to break this up trend line at a quiet time to generate some selling activity so the trend can be reasserted after lunchtime with some shares picked up cheaply? Or all of the above?

Thanks for the feedback - invaluable.
 
Alot of good stuff on here.
Thanks motorway, Timmy, for your contributions.

I will review it properly tonight.
 
Tim and M/W.

While I understand what your doing.

Time is still an important factor for me. It allows me to have some idea when a short term move I'm trading is likely to complete.
While not entirely accurate I know wether a move is shaping up as it should or stalling.
Just anther aspect of the analysis.
Very fast moves normally indicate a fast and sharp correction to the mean.
 
Nizar, thanks for that, and feedback welcome.

Tech, I know what you are saying, and I think using time-based charts is going to depend on what is being traded and how. My experience with this stuff so far is entirely in a live day-trading only market (for me), where I am not using time-bars at. Time is still tracked, though, the bars print at differing rates depending on volumes going through, the speed of printing measures time.

I can imagine if you are trading an equity with a multi-day timeframe then any of this is going to be used quite differently. If at all? I wonder at its usefulness beyond day-trading.

---

Below is a post I prepared earlier!


---

OK, there seems to be a lot to discuss here regarding the use of using bars cut up by volume or range as opposed to time. I don’t think we have scratched the surface, but nevertheless, onwards.

What about cutting up the volume according to different measures?

The title of this thread is “new analysis technologies”, so can I introduce another new one (well, it was to me)?

The first chart attached to this post has volume posted below it, but volume presented in 3 ways. The bars are constant volume, in this case each bar is formed from the trading of 4,000 contracts. It is a quick-forming bar, and is of value for short-term trading. The first chart is a blow-up to explain the components of volume.

Now, because it is a constant volume bar, the volume for each price bar is the same, in this case 4,000.

The volume bar labelled “1”, and coloured the darker of the green, shows the amount of volume that traded at the offer price over the course of the bar forming. In the case of the bar labelled with the “1” this is about 3,200.

What is meant by trading at the offer is this is 3,200 contracts over the course of the bar where the buyers were “impatient” enough to jump in to buy at whatever the sellers were asking. I would refer to this as “aggressive” buying.

By implication, 800 contracts (4,000 minus 3,200) were bought by more patient buyers who had their bid hit. Also by implication, 800 contracts were sold by sellers impatient enough to sell at the bid (aggressive sellers), and also again by implication, 3,200 contracts were sold by sellers sitting patiently on the offer.

Anyone with an interest in VSA might be sitting up a little straighter in their chairs at this stage – in electronic markets the ability exists to see what the buyers and sellers are doing within each bar (at each price actually) in real time. The implications are not linear – “more aggressive buyers therefore I will buy too” is not necessarily a profitable tactic – but certainly they are interesting?

The lighter, or brighter colour green, labelled “2” in the first chart is the “aggressive” buying done by buyers trading 100 or more contracts in one hit – big, aggressive buyers. (Now, this needs to be monitored carefully, what if one buyer pays the offer for 150 contracts at one go, but the sellers are made up of a 20, 15, 25, 80, 5 and 5, I don’t know if this is reported as one trade of 150 or 6 trades of the amounts I detailed, I would love to hear more info on this).

The hollow red is the aggressive sellers, those sellers trading in hits of 100 or more. This is labelled “3”.

Of course these definitions of 100 or more are my definitions, you can choose whatever you wish. By the way, this stuff exists in many different softwares, I am not pushing any particular one.

OK, is this information of value, and if so how can you use this information? Well, that’s for you to answer, not for me to say. I am using it, but still haven’t settled on the one true approach (for me). Hence this thread, feedback appreciated.

Second chart attached shows the first 2 hours of regular trading hours of a 4000 volume constant bar chart, with volumes cut up as described.
 

Attachments

  • asf 3.JPG
    asf 3.JPG
    53.3 KB · Views: 303
  • asf 4.jpg
    asf 4.jpg
    90.5 KB · Views: 298
Tim I like it!

I can see that the trend stalls when less agressive buyers just sit and wait.
Moves both ways are supported by in patient volume either sellers of buyers.

What software does the Volume bars?
Do you know if this can be done for equities?

I see this as supportive of VSA analysis and even deeper inside a bar than what is available with VSA now.
 
Top