- Joined
- 13 February 2006
- Posts
- 5,304
- Reactions
- 12,246
A follow up article:
In the August 19, 2024 update, it was noted that Q2 2024 gold bar withdrawals from the London Over-The-Counter (OTC) market was the largest Q2 physical gold withdrawal from this market going back to 2000.
Since that update additional quarterly data going back to 2010 have been sourced with the kind assistance of Nick Laird of goldchartRus.com (thanks Nick!). This data shows several interesting facts about physical gold withdrawn from the London market - the world’s largest cash/spot gold market.
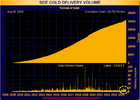
First, note that since January 2020 there have been 6 quarters where more than 200 tonnes of gold have been withdrawn from the London OTC market whereas this had only happened twice in the prior 10 year (see Figure 1 below).
Second, withdrawals of gold from the London OTC market of 391 tonnes in Q3 2020 and 463 tonnes in Q4 2020 were larger than the most recent available datum point of a 329 tonnes withdrawn in Q2 2024.
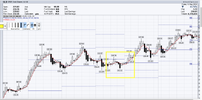
However, the 391 tonnes supplied to market in Q3 2023 appears to have been sufficient to help cap the London price of gold at $2,035 USD/oz. in August after which the following 463 tonnes supplied to market in Q4 2020 was followed by a price drop to $1,700 in March 2021 as shown by the red arrow in Figure 2 below.
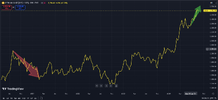
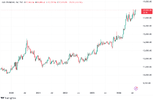
Despite the lesser 329 tonnes of gold withdrawn from the London OTC market in Q2 2024, the gold price has continued to move higher in July and August of this year as shown by the green arrow in Figure 2 below.
The gold supplied to market has been insufficient to supply market demand forcing the London price higher since June.
Figure 1 - London OTC Market Gold Quarterly Gold Withdrawals 2010 through 2024; source: gold.org
Figure 2 - Weekly Cash/Spot Gold Price March 2020 to Present
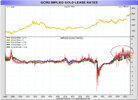
Figure 3 shows that the gold market physical shortage stress can also be seen in the elevated market Implied Gold Lease Rates since 2022.
The implied gold lease rate below indicates the cost for market traders to borrow gold when required to deliver on their cash gold promissory note contracts that they have sold into the market.
Figure 3 - Implied Gold Lease Rate; souce: goldchartrus.com
Where is the remainder of the gold to meet claims standing in the London market going to come from?
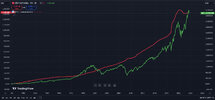
Figure 4 - Implied Silver Lease Rate; souce: goldchartrus.com
Physical withdrawal levels along with elevated physical market stress levels indicate that the gold and silver markets are going to become even more interesting.
jog on
duc
In the August 19, 2024 update, it was noted that Q2 2024 gold bar withdrawals from the London Over-The-Counter (OTC) market was the largest Q2 physical gold withdrawal from this market going back to 2000.
Since that update additional quarterly data going back to 2010 have been sourced with the kind assistance of Nick Laird of goldchartRus.com (thanks Nick!). This data shows several interesting facts about physical gold withdrawn from the London market - the world’s largest cash/spot gold market.
First, note that since January 2020 there have been 6 quarters where more than 200 tonnes of gold have been withdrawn from the London OTC market whereas this had only happened twice in the prior 10 year (see Figure 1 below).
Second, withdrawals of gold from the London OTC market of 391 tonnes in Q3 2020 and 463 tonnes in Q4 2020 were larger than the most recent available datum point of a 329 tonnes withdrawn in Q2 2024.
However, the 391 tonnes supplied to market in Q3 2023 appears to have been sufficient to help cap the London price of gold at $2,035 USD/oz. in August after which the following 463 tonnes supplied to market in Q4 2020 was followed by a price drop to $1,700 in March 2021 as shown by the red arrow in Figure 2 below.
Despite the lesser 329 tonnes of gold withdrawn from the London OTC market in Q2 2024, the gold price has continued to move higher in July and August of this year as shown by the green arrow in Figure 2 below.
The gold supplied to market has been insufficient to supply market demand forcing the London price higher since June.
Figure 1 - London OTC Market Gold Quarterly Gold Withdrawals 2010 through 2024; source: gold.org
Figure 2 - Weekly Cash/Spot Gold Price March 2020 to Present
Figure 3 shows that the gold market physical shortage stress can also be seen in the elevated market Implied Gold Lease Rates since 2022.
The implied gold lease rate below indicates the cost for market traders to borrow gold when required to deliver on their cash gold promissory note contracts that they have sold into the market.
Figure 3 - Implied Gold Lease Rate; souce: goldchartrus.com
It is telling that the level of quarterly gold withdrawals that since 2022 have peaked at 329 tonnes per quarter in the London OTC gold market should stress this market for physical gold.This August 24, 2024 post showed that there is an estimated 9,500 tonnes to 14,300 tonnes of standing claims in the London cash (immediate ownership) OTC gold market.
Where is the remainder of the gold to meet claims standing in the London market going to come from?
A withdrawal rate estimated at 3.5% or less of standing cash gold claims per quarter appears to be stressing the London OTC cash/spot physical gold market.
Silver
The elevated implied silver lease rate shown below tells us a similar story to gold: the silver market is not adequately supplied to meet withdrawal levels at current prices:This August 24, 2024 post showed that there is an estimated 132,000 tonnes to 198,000 tonnes of standing claims in the London cash (immediate ownership) OTC silver market.
Figure 4 - Implied Silver Lease Rate; souce: goldchartrus.com
In Closing
The gold and silver markets are demanding higher gold and silver prices to meet current physical demand.Physical withdrawal levels along with elevated physical market stress levels indicate that the gold and silver markets are going to become even more interesting.
jog on
duc


