- Joined
- 25 July 2021
- Posts
- 875
- Reactions
- 2,215
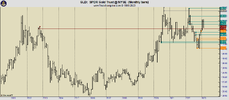
GLD is at a important level, looking at the monthly chart it can be seen that it's currently in a resistance/support zone coming from the Oct 2012 top.
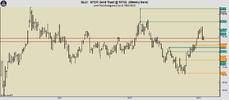
The weekly charts shows in more detail how this zone has acted as support and resistance in the past.
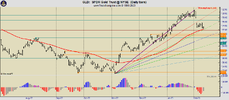
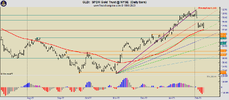
Looking at the daily chart I've added some indicators showing that price is also coming close to the 50sma and the 0.382 time & price Fib line. I've added my momentum indicator which shows that momentum is still to the downside, but this next week should show us if buyers are willing to come back into this market or not.

The weekly charts shows in more detail how this zone has acted as support and resistance in the past.

Looking at the daily chart I've added some indicators showing that price is also coming close to the 50sma and the 0.382 time & price Fib line. I've added my momentum indicator which shows that momentum is still to the downside, but this next week should show us if buyers are willing to come back into this market or not.


