- Joined
- 29 January 2006
- Posts
- 7,228
- Reactions
- 4,476
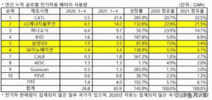
Your chart graphic was based off 4 months data - Jan to end-April. However it actually showed the percentage change over the same 4 months in 2020, as you can see here:I'm not sure what you mean. The data I show dated April 2021 is out of date? But your data which shows "% growth, 2016 to 2020" proves that BYD is the worlds number 3 battery manufacturer?
Possible and probable is not factual.
I am currently investing in the EV and related industries, I need more facts than probabilities.

I used an industry site with information for the year to December. I could not access their data as I am not a paid subscriber, so I don't know why they placed BYD third, but they did.
I used the CATL percentage change of 3400% to show how quickly the NEV scene changes, not BYD data.
My previously posted table here may be more accurate, but I cannot be sure.
So based on the Chinese language table above and the fact that BYD sold only 15% of their cars in the period to April, the question is did the other 85% lead to them overtaking Panasonic in the period to December?
I am not aware if data is freely available to be definitive, so without it I am simply saying it was not impossible for BYD to catch up. Perhaps you can actually stump up with enough apples to compare, as until then the jury is out or, in your parlance, "I need more facts."
YesAny other source besides a YouTube video?
BYD makes its own chips.


