Australian (ASX) Stock Market Forum

Dump it Here

Thinking look.jpg
Paper Trading a Supertrend Strategy with a "Twist"
A Supertrend indicator identifies market trends using the Average True Range (ATR) to measure volatility and adjust its sensitivity. But here’s a twist to the original concept - what if we apply “Machine Learning” to enhance a basic Supertrend indicator, allowing it to adapt to different market conditions and dynamically adjust for more accurate signals?

Imagine a car GPS showing the current route
Now, think of a smart GPS that learns from past traffic patterns and adjusts your route dynamically to avoid jams — that’s what "Machine Learning" does for a Supertrend indicator.

Key Takeaways
1. A Supertrend Indicator identifies market trends.
2. A Supertrend Indicator with "Machine Learning" adapts to market conditions
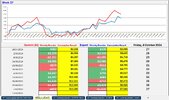
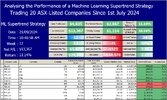
3. A Supertrend Indicator with "Machine Learning" - theoretically, it should be more accurate but to no avail, with a low win rate of 38%.
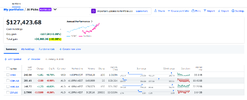
4. After 12 weeks the overall results aren't too shabby.
Screenshot 2024-09-21 135241.jpg

Skate.
 
5. AIs v Human GROWTH Logo.jpg
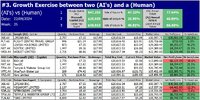
Fund Manager vs. Two (AI) Models
Yesterday, we explored a one-on-one scenario between Google's Gemini (AI) and a Fund Manager. Today, we introduce Microsoft’s (AI) model, Copilot, to compare and contrast it with Google’s (AI).

Results after 35 Weeks
While this is a fun and insightful “thought experiment,” it underscores an important point: (AI) is poised to become a crucial tool for making more informed decisions across a wide range of topics.

AI Model Variability
With numerous (AI) models to choose from, I’ve selected Google and Microsoft for a direct comparison. Although trained on different datasets, both models operate under the same instructions. Microsoft Copilot and Google Gemini offer unique strengths that can complement the skills of a human fund manager.

5a. Two AIs v Expert Summary Result Growth Stock.jpg

Skate.
 
(AI) as a Complementary Tool
Large language models (LLMs) like (AI) generate responses based on patterns, which can sometimes result in incorrect or nonsensical outputs. To avoid such errors, questions must be precise and unambiguous as @DrBourse has pointed out. While (AI) models are powerful tools, they are not infallible.

Summary
The main limitation of "free" (AI) models is that while users often seek accurate information, these models are structured to produce text that seems correct, which can sometimes lead to inaccuracies that users may not notice.

Skate.
 
i am NOT saying rush out and buy this ETF , but maybe it could give you some ideas if creating your own AI scanning tool

Human oversight is essential when using (AI)
The primary limitation of “free” (AI) models is that while users often seek accurate information, these models are designed to generate text that "appears correct". This can sometimes result in inaccuracies that users "may not" immediately recognise.

From the article:
"AI has been praised for its ability to process massive datasets quickly, eliminating the need for human analysts to perform tedious tasks. However, its ability to consistently outperform traditional strategies remains unproven. In order to prevent "hallucination" - in which a LLM either "fabricates information" or "misinterprets input" - This means human oversight is required at every step of the procedure.

Skate.
 
1. AI v Human INCOME Logo.jpg
The article by Chris Conway of Livewire Markets, which inspired this exercise, highlights the evolving capabilities of (AI) in stock picking. As (AI) technology continues to improve, it will be interesting to see how it compares to humans in the field of finance.

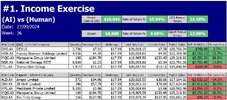
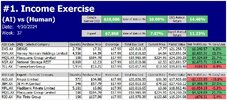
Explanation - Fundie vs AI: The best ASX "Income" stocks for the next 12 months
This is a theoretical investment exercise pitting Google's (AI) Gemini against Dr Don Hamson from Plato Investment Management in selecting five "Income" stocks for the next 12 months.


Results after 36 weeks
We recognise that this is nothing more than a fun, but nonetheless important, thought experiment. Ultimately, (AI) will likely become a tool that all use to make more informed decisions, across a broad range of topics.

2. SummaryResult.jpg


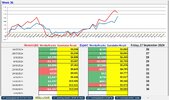
3. WeeklyUpdate.jpg

Skate.
 
3a. AI v Human GROWTH Logo.jpg
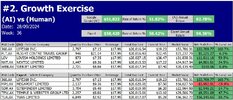
Fundie vs AI: Who is the better stock picker?
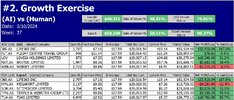
Yesterday's post focused on "income" stocks. Today's post examines "growth" stocks.

The Article by Chris Conway of Livewire Markets
The article, (hyperlinked below) inspired this exercise, which highlights the evolving capabilities of (AI) in stock picking. As (AI) technology continues to improve, it will be interesting to see how it compares to humans in finance. This is a theoretical investment exercise pitting Google's (AI) Gemini against Tobias Yao from Wilson Asset Management in selecting five "Growth" stocks for the next 12 months.


Results after 36 weeks
We recognise this is nothing more than a fun, but important, "thought experiment" as ultimately, (AI) will likely become a tool that all use to make more informed decisions, across a broad range of topics.

4. Summary Result Growth Stock.jpg

Skate.
 
5. AIs v Human GROWTH Logo.jpg
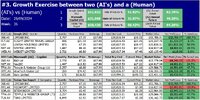
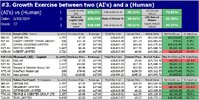
Fund Manager vs. Two (AI) Models
Yesterday, we explored a one-on-one scenario between Google's Gemini (AI) and a Fund Manager. Today, we introduce Microsoft’s (AI) model, Copilot, to compare and contrast it with Google’s (AI).

Results after 36 Weeks
While this is a fun and insightful “thought experiment,” it underscores an important point: (AI) is poised to become a crucial tool for making more informed decisions across a wide range of topics.

AI Model Variability
With numerous (AI) models to choose from, I’ve selected Google and Microsoft for a direct comparison. Although trained on different datasets, both models operate under the same instructions. Microsoft Copilot and Google Gemini offer unique strengths that can complement the skills of a human fund manager.

5a. Two AIs v Expert Summary Result Growth Stock.jpg

Skate.
 
i guess investors/traders are now confronted with a tough question

do you pay an 'expert the fees , or do you fine-tune an AI , for a 'near enough ' result ( after fees are deducted from the results )

@divs4ever that’s a great point. (AI) is increasingly being used as a tool for making informed trading decisions. However, the data these models are trained on may not always be up-to-date or accurate, which can lead to incorrect or nonsensical outputs.

While (AI) models are powerful, they are not infallible
That’s why it’s essential to critically evaluate the information provided by (AI). Ultimately, the decision between paying an expert or fine-tuning an (AI) depends on the trader’s ability.

Would I use (AI) as a trading tool?
Not at this stage.

Summary
Both approaches have their advantages and limitations, and a combination of human expertise and (AI) "assistance" might offer the best approach.

Skate.
well when i started , i concocted a series of multiple parameter scans ( starting with the entire ASX )

now i usually thinned it down to ten or less targets and THEN started researching each target ( some were easier to cull than others ) and THEN after having a few targets i would start working out attractive price entries

now i don't know if the AI data-sets are any more current than the ones i use ( as a 'no-frills' investor ) but then AI might be tapped into the latest investor presentations/roadshows and that might be a positive/negative warp to the process

would i use AI as a scanning tool ( as i pointer on which stocks to research first ?

MAYBE

but currently i am looking for sectors ( REITs to substitute for bond exposure , for example )

now AI to scan news feeds ( for the short-term traders ) now that might be a goer ( but i avoid that strategy nearly all the time )

have AI scan the broker recommendations , presentations , etc.
 
1. AI v Human INCOME Logo.jpg
The article by Chris Conway of Livewire Markets, which inspired this exercise, highlights the evolving capabilities of (AI) in stock picking. As (AI) technology continues to improve, it will be interesting to see how it compares to humans in the field of finance.

Explanation - Fundie vs AI: The best ASX "Income" stocks for the next 12 months
This is a theoretical investment exercise pitting Google's (AI) Gemini against Dr Don Hamson from Plato Investment Management in selecting five "Income" stocks for the next 12 months.


Results after 37 weeks

We recognise that this is nothing more than a fun, but nonetheless important, thought experiment. Ultimately, (AI) will likely become a tool that all use to make more informed decisions, across a broad range of topics.

2. SummaryResult.jpg


3. WeeklyUpdate.jpg

Skate.
 
3a. AI v Human GROWTH Logo.jpg
Fund Manager vs AI: Who is the better stock picker?
Yesterday's post focused on "income" stocks. Today's post examines "growth" stocks.

The Article by Chris Conway of Livewire Markets
The article, (hyperlinked below) inspired this exercise, which highlights the evolving capabilities of (AI) in stock picking. As (AI) technology continues to improve, it will be interesting to see how it compares to humans in finance. This is a theoretical investment exercise pitting Google's (AI) Gemini against Tobias Yao from Wilson Asset Management in selecting five "Growth" stocks for the next 12 months.


Results after 37 weeks
We recognise this is nothing more than a fun, but important, "thought experiment" as ultimately, (AI) will likely become a tool that all use to make more informed decisions, across a broad range of topics.

4. Summary Result Growth Stock.jpg


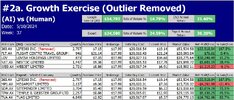
At times, outliers can distort the overall picture
Removing these outliers often provides a clearer view of returns. For instance, Life360 (ASX:360) is one such outlier. Even after excluding this outlier, the results over 37 weeks remain respectable.

4a. Summary Result Growth Stock - OUTLIER REMOVED.jpg

Skate.
 
9 or 6.jpg

Visualising Buy and Sell Signals
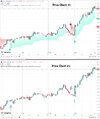
As a beginner, understanding when to buy and sell can be daunting. System trading simplifies this by providing clear signals based on specific indicators. The two price charts below display how you can visualise these signals on a price chart.

Understanding System Trading Signals
System trading uses indicators to generate buy and sell signals and they tell you:

What to Buy
When to Buy
When to Sell

Visualising Signals
The graphic displays two approaches when it comes to visualising these signals.

Price Chart #1: Colourful Visuals
Green and Red Shading: Indicates buy and sell periods.
Arrows: Green for buy signals, red for sell signals.
Pros: Easy to see performance at a glance.
Cons: It can be visually overwhelming.

Price Chart #2: Clean Representation
Arrows Only: Lime and maroon arrows are used for signal bars, and blue arrows are used for action bars (Buy and Sell Bars).
Pros: Cleaner and less cluttered.
Cons: It may require more interpretation.

Which is Better?
The choice between colourful visuals and a cleaner representation depends on your preference.

Colourful Visuals
Great for those who prefer a quick, at-a-glance understanding of performance.

Clean Representation
It is ideal for those who prefer a minimalist and focused view.

Conclusion
Both methods have their merits. As you start your trading journey, experiment with both to see which helps you better understand and act on trading signals.

Which Looks Better.jpg

Skate.
 
View attachment 185398
Fund Manager vs AI: Who is the better stock picker?
Yesterday's post focused on "income" stocks. Today's post examines "growth" stocks.

The Article by Chris Conway of Livewire Markets
The article, (hyperlinked below) inspired this exercise, which highlights the evolving capabilities of (AI) in stock picking. As (AI) technology continues to improve, it will be interesting to see how it compares to humans in finance. This is a theoretical investment exercise pitting Google's (AI) Gemini against Tobias Yao from Wilson Asset Management in selecting five "Growth" stocks for the next 12 months.


Results after 37 weeks
We recognise this is nothing more than a fun, but important, "thought experiment" as ultimately, (AI) will likely become a tool that all use to make more informed decisions, across a broad range of topics.

View attachment 185399


At times, outliers can distort the overall picture
Removing these outliers often provides a clearer view of returns. For instance, Life360 (ASX:360) is one such outlier. Even after excluding this outlier, the results over 37 weeks remain respectable.

View attachment 185400

Skate.

Looks like BARD misjudged the travel industry comeback with FLT and WEB. Seemed like logical picks but I wonder what the algo got wrong with it's decisions.
 
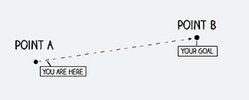
Point A to point B.jpg
What Performance Results Are Good Enough to Accept?
Starting out in trading can be intimidating, especially with the fear of losing money you can’t afford to lose. It’s important to remember that there’s no perfection in trading. Instead, focus on finding a strategy with fair to good performance that wins more money than it loses.

The Reality of Trading
Every trader, new or experienced, faces the risk of losses. The key is to have a strategy that wins more than it loses. This isn’t about perfection but about being in the right positions that others push up due to emotions, news, or other factors.

Accepting “Good Enough”
From my perspective, a strategy that wins more than it loses in dollar terms is a good one. You might elect to buy good companies, but buying them at the wrong time can lead to disappointment. However, even if not spectacular, positive trading results can still make trading enjoyable and profitable.

Performance Metrics
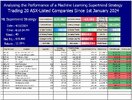
Below is a performance metric over 40 weeks to demonstrate that results don’t need to be fantastic to enjoy trading. Winning is the name of the game, and sometimes good enough is good enough. Better can come with more experience.

Conclusion
As you start your trading journey, remember that “good enough is often good enough.” Focus on learning and improving your strategy over time. Consistency can build up to significant success.

SuperTrend Metrics.jpg

Skate.
 
Looks like BARD misjudged the travel industry comeback with FLT and WEB. Seemed like logical picks but I wonder what the algo got wrong with it's decisions.

@Sean K that is a great observation.

Playing a game of uncertainties is rewarding when you get it right, but changes in circumstances or market movements can catch the best of us off guard.

Recently, I’ve concentrated my posts on 20 of the top ASX companies. They fluctuate, but that’s what "Technical Analysis" aims to capture. On average, it’s 45% correct most of the time, and as I mentioned in my last post, sometimes “good enough is good enough.”

Skate.
 
5. AIs v Human GROWTH Logo.jpg
Fund Manager vs. Two (AI) Models
Yesterday, we explored a one-on-one scenario between Google's Gemini (AI) and a Fund Manager. Today, we introduce Microsoft’s (AI) model, Copilot, to compare and contrast it with Google’s (AI).

Results after 37 Weeks
While this is a fun and insightful “thought experiment,” it underscores an important point: (AI) is poised to become a crucial tool for making more informed decisions across a wide range of topics.

AI Model Variability
With numerous (AI) models to choose from, I’ve selected Google and Microsoft for a direct comparison. Although trained on different datasets, both models operate under the same instructions. Microsoft Copilot and Google Gemini offer unique strengths that can complement the skills of a human fund manager.

(AI) as a Tool
The experiment underscores the potential of (AI) models in aiding investment decisions. While (AI) can analyse vast data sets and identify trends quickly, as Tobias Yao demonstrated, human expertise can still outperform (AI) in certain scenarios. This highlights the complementary strengths of (AI) and human insight in financial decision-making.

5a. Two AIs v Expert Summary Result Growth Stock.jpg

Skate.
 
Basics of Trading We All Tend to Forget (Demand versus Supply = Price)
The core principle is that the price of a company is determined by its demand and supply. When demand is high and supply is low, the price goes up. Conversely, when supply is high and demand is low, the price goes down.

Trend Following
It all starts with trend following. This is a technical analysis method that seeks to identify and trade in the direction of the trend, which can last longer than anyone can predict. Excess demand or supply creates these trends. The key is to buy in uptrends (rising prices) and sell in downtrends (falling prices). Understanding these basic principles makes trading decisions easier. This is why (price chart) graphics are crucial as they allow you to see how previous moves turned out, giving a fair indication of how the strategy may work going forward.

Skate’s Machine Learning SuperTrend Strategy
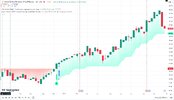
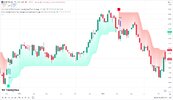
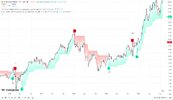
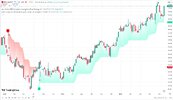
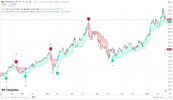
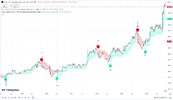
This TradingView strategy is showing great potential. At its core, the strategy utilises the “SuperTrend” indicator, enhanced with additional features to generate precise buy and sell signals. The Average True Range (ATR) sets the upper and lower bands, making it adaptable to market volatility. Designed for a weekly timeframe, this approach offers a unique perspective on trading. So far, the results are promising, and the charts indicate a positive outlook.

Price Chart Graphics
To maximise gains, aim to ride the green-shaded areas, which indicate favourable conditions. Conversely, avoid holding positions during the red-shaded areas, as these signify less favourable conditions. This visual approach helps traders quickly identify optimal times to enter and exit trades, enhancing the decision-making process.

SuperTrend Chart - CBA.jpg


SuperTrend Chart - FMG.jpg


SuperTrend Chart - GMC.jpg


SuperTrend Chart - REA.jpg


SuperTrend Chart - WDS.jpg


SuperTrend Chart - WES.jpg


SuperTrend Chart - WTC.jpg

Skate
 
Top