Australian (ASX) Stock Market Forum

Dump it Here

Buying and Selling Pressure Indicator
The Buying and Selling Pressure Indicator (developed by another) has invoked a lot of interest which is actually a very simple indicator using the excursion of the price.

Many times it is just a matter of how we are looking at the data
We can glean a lot of information if we look at the data the right way. The buying and selling pressure indicator is also the same case. It's a very simple Indicator, using the Open, High, Low, and Close and the Volume. It obviously not a Holy Grail, but does give a very good picture of the buying and selling pressure.

The "raw buying and selling indication"
Is provided in terms of a Histogram. Green bars above zero show the buying pressure and the red bars below the zero line show the selling pressure. This presents a good visual representation of the dominating pressure.

The second is a "smoothed version"
This version with a yellow line representing the selling pressure and a turquoise line which represents the buying pressure. If the turquoise line is above the yellow line it would mean that the buying pressure is more and vice versa. The difference between the two is plotted as a Histogram. This is a cumulative value of the buying and selling pressure and provides an easy visual presentation of the dominating pressure.

The trifecta
The two indicators the (Raw and Smoothed Buying Pressure Indicator) and the (Percentage Up Filter) can easily complement any trading strategy.

View attachment 160265

Skate,
Thanks.

It's a very simple Indicator, using the Open, High, Low, and Close and the Volume

How does it use volume when indices like XAO don't have volume?

 
How does it use volume when indices like XAO don't have volume?
In summary
@Gringotts Bank the "Buying and Selling Pressure Indicator" uses price spreads and ranges to calculate buying/selling pressures, normalizes them by their own EMAs, weights them by normalized volume, and smoothes the final result. The difference between the volume-weighted pressures gives the overall force indicator. In a nutshell, the buy and sell pressure uses volume-weighted averages.

So there is no misunderstanding
Here is a definition of the array name and below is the process.
1. sp = price spread
2. bp = range
3. bpavg, spavg = buying price average and the price spread average normalization (EMAs)
4. nbp, nsp = normalized buying price (nbp) and normalized price spread (nsp)
5. diff = force indicator
6. Varg = volume normalization EMA
7. nv = normalized volume
8. nbfraw, nsfraw = volume weighted pressures
9. nbf, nsf = final smoothed pressures
10. diff = final force indicator

The key steps in English
1. Calculate the price spread (sp) as High - Close and buying pressure (bp) as Close - Low.
2. Smooth (bp) and (sp) using EMAs to get (bpavg) and (spavg).
3. Normalize (bp) and (sp) by dividing by their EMAs to get (nbp) and (nsp).
4. Calculate the difference between (nbp) and (nsp) to get the force indicator (diff).
5. Smooth the volume using an (EMA) to get (Varg).
6. Normalize volume by dividing by (Varg) to get (nv).
7. Multiply (nbp) and (nsp) by (nv) to weight them by normalized volume.
8. Further smooth the volume weighted (nbp) and (nsp) using EMAs to get the final buying (nbf) and selling (nsf) pressures.

Summary
I've taken the time and care to explain the process. I normally resist discussing complex coding as it tends to raise questions because of a lack of understanding. Discussing advanced coding is tricky without assessing the other person's baseline knowledge first. My aim is not to show off knowledge, but rather to provide meaningful explanations that enrich mutual understanding.

Skate.
That's fine, but my question was...

How does the code reference volume when indices like XAO don't have volume?
It's a fair question, asked in good faith.
 
How does the code reference volume when indices like XAO don't have volume?
@Gringotts Bank, you're right that the XAO (Australian All Ordinaries) does not have volume information available. The key is that the "Buying and Selling Pressure Indicator" is referencing the volume (V) of the "underlying stocks that make up the index". So even though the index itself does not have volume data, the individual constituent (stocks) do.

So when the "Buying and Selling Pressure Indicator" is run on an index like XAO, it is actually looking at the volumes of all the stocks that comprise that index. It sums up and averages their volumes in order to come up with overall volume metrics for the index.

Specifically, the Varg variable calculates an 80-period EMA of the total aggregated volumes of the underlying stocks. This smoothed aggregate volume is then used to normalize the buy/sell pressures via the nv variable.

So in summary, even without direct volume data on the index chart itself, the "Buying and Selling Pressure Indicator" makes use of the volumes from the individual component stocks to create volume-weighted metrics. This allows the "Buying and Selling Pressure Indicator" to work across both regular stocks with volume and the index without direct volume data.

Skate.
 
@Gringotts Bank, you're right that the XAO (Australian All Ordinaries) does not have volume information available. The key is that the "Buying and Selling Pressure Indicator" is referencing the volume (V) of the "underlying stocks that make up the index". So even though the index itself does not have volume data, the individual constituent stocks do.

So when the "Buying and Selling Pressure Indicator" is run on an index like XAO, it is actually looking at the volumes of all the stocks that comprise that index. It sums up and averages their volumes in order to come up with overall volume metrics for the index.

Specifically, the Varg variable calculates an 80-period EMA of the total aggregated volumes of the underlying stocks. This smoothed aggregate volume is then used to normalize the buy/sell pressures via the nv variable.

So in summary, even without direct volume data on the index chart itself, the "Buying and Selling Pressure Indicator" makes use of the volumes from the individual component stocks to create volume-weighted metrics. This allows the "Buying and Selling Pressure Indicator" to work across both regular stocks with volume and the index without direct volume data.

Skate.
ok that makes sense. Haven't seen the code so I don't know what Varg does.

In my attempt at the same thing, I used VAS (ETF), since it has its own volume.
 
Amibroker + Norgate Data + Coding skill, most things are possible.

Skate.
aha, coding skill. Maybe that's where I was lacking!

FWIW, my own VAS market filter has been looking quite poorly for a long time, but it did turn up on Jul 25th. Although I think mine needs a bit of work. Not too sure of its accuracy.
 
Last edited:
Didn't you post the idea to keep things simple?
I prefer the percentage UP filter. So simple, and it did trigger in the second week of July to catch the rally.
 
Didn't you post the idea to keep things simple?
I prefer the percentage UP filter. So simple, and it did trigger in the second week of July to catch the rally.

@peter2 as usual you're right, I did suggest keeping things simple in my previous post on the "Percentage Up" filter. The percentage UP filter is a great example of a straightforward approach that I've found to be effective in my trading.

The main advantages of using a simple "Percentage Up" filter are:
1. It's easy to understand and implement.
2. No complex formulas are required.
3. It adapts to the volatility of the market.
4. It avoids over-optimization.
5. Too many complex buy filters can lead to curve-fitting, one is enough.
5. The "Percentage Up" filter is nothing more than a buy "timing filter"

As you mentioned, the "Percentage Up" filter triggered a timely buy signal in July to catch the start of the recent rally. This shows the power of a basic approach and if a simple method works, there's no need to make things more complicated than they need to be.

In summary, I agree the "percentage up" buy filter aligns well with a simple principle, of only buying positions when the majority of the individual constituent in the index is advancing.

Thanks for the feedback and example reinforcing the value of straightforward, intuitive techniques vs. unnecessary complexity. When I started this thread I made it a point to talk to my audience (the beginner) if I still have one.

Peter, I also appreciate you keeping me accountable for my own advice!

NB
If I had to proofread my posts, I for one would be exhausted. Instead of spewing out what's on my mind, it would be more productive to resist posting and only respond to comments or questions, giving readers some respite.

Skate.
 
I was a little disappointed that you stopped the SAP system demo. You started with a few errors but quickly corrected them and I wasn't troubled by that. I was surprised by the depth of your concerns regarding continuing. We're all going to make mistakes occasionally. I even bought 10,000 shares instead of 1000 recently. I sold the 9000 immediately, paying the additional brokerage as the cost for my mistake.

The SAP system would have been triggered into the market again in that second week of July by your Percentage - UP filter and I'm certain the system portfolio would have gained nicely in the two weeks since then.

Do you plan on demo'ing any system soon for the beginners and others like myself?

Peter, as a trader, I understand the desire to see a system through despite early mistakes. However, in this case, I felt it was important to stop the live trading demonstration once you highlighted the coding error. Rushing into live trading without thorough backtesting and paper trading can lead to bigger issues down the line.

While occasional mistakes are normal, this was a fundamental flaw in the system and Amibroker's parameter settings, basically, I didn't reset the code back to the original settings after testing. I want to take the time to properly evaluate and improve the strategy before considering live trading again. Building trust with the community requires transparency when things don't go as planned.

My goal is to provide robust, time-tested strategies that can consistently perform over the long run. I'm working diligently on enhanced versions of the SAP system and will certainly keep you posted once I feel confident in the results.

Skate.
 
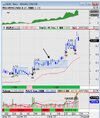
Break-out of a small trading range (shown by blue rectangles).

ASX:KGN
@peter2, effective use of a trading range defining a clear breakout level with the blue rectangles provides an objective entry trigger and risk point. This trading range sets up precise breakout logic. Using confirming indicators adds robustness. Relying on more than one factor improves the probability of a successful continuation. Having an objective break level along with confirming indicators turns a strategy into a calculated, high-probability trading plan.


Peter KCN.jpg


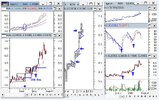
In our trading group some also trade breakouts but all with differing setups and all have success of varying degrees. I have explained my setup previously and to satisfy my curiosity, I looked at KGN as a comparison to yours.

Of course it is easy to find breakouts but the challenge is to pick out those that will go on with it, and that is why I have quite a few criteria to be satisfied. As we have all found, some of the really good lookng breakouts can fail a few days later.

ASX:KGN
@Country Lad nails it with this comment: "Of course, it is easy to find breakouts but the challenge is to pick out those that will go on with it, and that is why I have quite a few criteria to be satisfied".

Country Lad KCN.jpg


A momentum breakout strategy: ASX:KGN
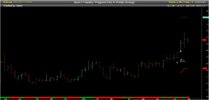
Using directional momentum indicators, smoothing, volatility adjustment, and volume-weighted breakouts are hallmarks of this strategy. The key with momentum breakouts is identifying ones with a higher probability of continuation as @Country Lad mentioned. The criteria help select these high-probability setups.

The volume confirmation on the breakout is crucial, from experience false breakouts are common. Adding filters like the volume check, volatility adjustment, and smoothing helps avoid whipsaws and improves the strategy's profitability. Momentum breakouts can be highly effective when executed selectively, and the indicators included help achieve that.

Skate's KGN.jpg


Summary
The key takeaway is that there are multiple effective approaches to profitable trading. The specific techniques used are not as important as the end result - generating consistent profits.

While the three trading strategies demonstrated may differ in their signals and logic, they share the common goal of identifying high-probability setups. Each aims to improve entry and exit timing to capture upside moves and cut losses.

Ultimately, traders must find a strategy whose process aligns with their skills and preferences. One trader may thrive using breakouts, another may excel at momentum. Rather than declaring a single best method, it is beneficial to keep an open mind about various valid strategies.

The above examples illustrate that success comes down to the proper execution of a structured, defined process. The specific indicators or tools employed are secondary to implementing a strategy with discipline, risk management, and continuous refinement based on performance.

There are many paths to consistency, and it is about determining the best personal match rather than rigidly following a prescribed formula. Focusing on sound trading principles and outcomes takes precedence over methods.

Skate.
 
Thinking ASF LOGO.png
I've been thinking
We all read a variety of books and especially when it comes to trading. Reading books about trading is a valuable part of my financial education. I reflect carefully on the key lessons and ideas, considering how I may apply them in a practical yet prudent manner to improve my long-term financial health and ability to provide for my family's needs.

The message is the same
Many of these books cover similar fundamental principles and concepts, with slight variations in perspective and emphasis. Over time, I have distilled these lessons into a few core truths that shape my trading approach. That is to remain disciplined and patient, keep costs low, diversify to reduce risk and maintain a long-term focus.

Simply put
I know speculative actions and attempts to "beat the market" regularly will likely lose to the market averages over time. While books can inspire new ideas, my primary goal is to incorporate what works for my specific needs, risk tolerance, and temperament. I prefer a plan I understand, can stick to consistently, and adapts over time based on experience.

Above all
I strive for the wisdom to know what I don't know and to avoid putting too much confidence in any one author's claims. Overall, my studies aim not just to grow wealth, but also to cultivate the knowledge, judgement, and mindset needed to make trading manageable. The common thread through all these trading and investing books is developing your mindset, knowledge, and skills to make wise financial decisions.

Skate.
 
Reading one book after another
I've gleaned a few basic, though the authors have different styles and ideas, they emphasize certain core principles. With each book I read, I endeavor to distill the key principles that can strengthen my trading approach. Though authors vary in style they emphasize certain core concepts that ring true based on human psychology.

Reading widely
As I read, I strive not just to absorb new trading ideas, but also to cultivate a mindset of constant improvement and opportunities they may provide. Doing so helps identify which trading ideas resonate most deeply that align with my temperament. I try to incorporate these ideas into a trading strategy.

Skate.
 
One of the biggest hurdles in trading is implementation, ie. placing the actual orders.

some examples:

- Broker limitations, eg. available order types, pricing discrepancies (esp with CFDs), speed
- Platform limitations, eg. time-outs for complex indicators, lack of bid-ask data
- Data feed limitations, eg. missing or incorrect data, spikes
- Personal time limitations, ie. excessive screen time requirements
- Internet latency limitations, (important when scalping)
- Assuming automation will be possible or easy. Sometimes it's simply not possible. When it is possible, it is a far bigger task than most realize. It needs a highly accomplished programmer, a lot of time and cost to set up.

It's not easy, because implementation often has to come near the end of the process, and by then it's usually too late. But it's definitely worth considering early on "Will I actually be able to implement this?".

"Will I actually be able to implement this?".

Hit the nail on the head with this one comment !!!!.

Even weekly trading can be difficult to achieve and will hit all the limitations you've mentioned, once you move into daily trading, day trading or intra-day trading the commitment level goes up exponentially. Add multiple strategies, Stocks, Futures, Currency and Crypto and it quickly becomes unmanageable.

I've automated most of my trading to try and eliminate this, but that doesn't mean the time commitment has decreased at all, it just means that the buying and selling tasks are done automatically for me. I still watch the basket like a hawk looking for anything and everything that could (AND DOES) go wrong.
 
What a great article
@ducati916, I believe the article you posted will resonate with a high percentage of members due to its accurate portrayal of the challenges and realities of trading. It captures the complex nature of trading, which demands careful decision-making, emotional resilience, and adaptability.


I completely agree with the author's perspective, particularly regarding the relatability of the image of the best trader in the world as an individual sitting at home, dressed casually, focused on their computer screen. This portrayal emphasises that successful trading can come from anyone, regardless of their profession, appearance, or location.

I especially liked the excellent point about the dangers of consuming too much information. The constant bombardment of other people's opinions can indeed cloud judgement and inject doubt into one's decision-making process.

Furthermore, the article rightly emphasises the often-underestimated aspects of execution and risk management in trading. While one technical analyst posting on Twitter may make it appear easy by pointing out trends and suggesting massive gains, the reality is that trading is never easy, and risk is always present.

I appreciate the diverse perspectives on trading approaches shared by others, as they provide valuable opportunities for genuine learning. While it's common for individuals to become focused on their own methods and perceive them as the exclusive path to success, it's important to acknowledge the abundance of ways to achieve profitability in the markets.

There are numerous ways to make money in the markets but what really matters is finding a strategy that works for you. My own unconventional approach to trading is just one among the many valid methods showcased on this forum, and I believe that focusing on a trading method that personally aligns is key. That's exactly what I did, and it has been beneficial in my journey.

Ultimately, trading is a personal pursuit, and everyone's journey is unique. It's essential to continuously learn and adapt by recognising the importance of proper execution and risk management to avoid costly mistakes. Capital preservation is the name of this game.

Skate.
 
Thinking has a huge place in trading
In trading, our capacity for reason and critical thinking is essential to avoid poor decision-making and financial losses. We must constantly challenge our own assumptions and flawed logic to make progress. While intuition and "gut feelings" have their place, ultimately trades should be made based on a rational assessment of the market, not emotions. Impulsive trades based on fear, greed, or hope rather than facts and evidence often end badly.

To improve our trading
We need an inquisitive mindset, always pursuing new ideas through research, backtesting, and analysis. We should question trading "truisms" and be willing to innovate rather than just follow the crowd. The markets are dynamic, so our thinking must be as well. Critical thinking enables us to spot biases, evaluate risks precisely, learn from past mistakes, and respond nimbly as conditions change. It leads to the creativity needed to solve problems and develop better strategies.

Thinking for oneself is difficult but essential
We must take full responsibility for our trades rather than just blindly following others. As lifelong learners, we should think actively rather than passively absorb information. The path to trading mastery requires tireless reflection, study, and improvement. By embracing reason over emotion, we can achieve more than we imagined possible. With discipline and an open mind, we can avoid faulty thinking and create the edge needed to prosper in the markets.

Skate.
 
Top