Australian (ASX) Stock Market Forum

Dump it Here

How I approached finding good trade entries
Momentum measures how quick & strong a price move is. When trend trading we need to be constantly looking for momentum before a breakout. If you go too early or too late I believe a world of pain awaits. Confirmation is required before you make a move & at times waiting for confirmation can be the hardest part of trading my way.

Entry confusion
Most traders are constantly obsessing about where & how to get into the market. Entry confusion happens to us all & it's for this very reason that trading systematically works. Why? because all your rules can be precisely coded for optimal performance. With so many entry styles to choose from many "trading gurus" will tell you what supposedly works but they rarely tell you what doesn’t. I start to wonder if these trading gurus ever follow their own _bullshit_. My piece of advice today is to forget about focusing on when to get into the market but rather figure out "when to stay out" of the market.

Summary
Using momentum as a forerunner to a breakout works, it's as simple as that. Anytime there is a significant move in the markets, momentum is a part of it. Without momentum, it will end up being a false breakout, these are the breakouts you need to avoid.

Skate.
 
forget about focusing on when to get into the market but rather figure out "when to stay out" of the market
@Skate your statement makes the point that a lot don't think about but to be more accurate, you know and I know that traders must focus on both 'when to get in' and 'when to stay out', they are two sides of the same coin. I know that you were highlighting the side that people tend to neglect but personally I think that it's important for traders to cement in the complete picture of understanding right from the start. Maybe I'm being a bit 'tomaato'/'tomarto' here but that's just what works for me.
 
@Skate your statement makes the point that a lot don't think about but to be more accurate, you know and I know that traders must focus on both 'when to get in' and 'when to stay out', they are two sides of the same coin.

@DaveTrade that's the very point I was trying to make, some system traders don't know that staying out at the markets at the precise time can be beneficial to trading performance. I was going to conclude my short series of posts today but I believe I should concrete what I'm saying with another post with an expanded description of how to achieve this. I'll also post a graphic so visual confirmation to explain what I've been talking about.

Skate.
 
Figuring out "when to stay out" of the market
This year has been a difficult trading year but if your strategy is selective knowing when to stay out & when to enter makes a difference. Being very selective in which positions to buy, those that have momentum & volume nearly always ensure that you will keep most of the bumps in profits. It's unavoidable that "exit confirmations" necessitate giving back some open profits but in saying this my trading methods are simple & repeatable.

Combine ROC & ADX & you have a momentum hunter
Blend these two indicators with the correct parameters & Bob's your uncle. Both ROC & ADX are essentially momentum-based indicators that measure the velocity of price movements. The ROC is a momentum-based indicator. Combined the ROC with an ADX indicator & you have a perfect indicator for measuring momentum & trend strength. Also, I use the ADX as a directional indicator as well.

staying out.jpg

Skate.
 
Figuring out "when to stay out" of the market
This year has been a difficult trading year but if your strategy is selective knowing when to stay out & when to enter makes a difference. Being very selective in which positions to buy, those that have momentum & volume nearly always ensure that you will keep most of the bumps in profits. It's unavoidable that "exit confirmations" necessitate giving back some open profits but in saying this my trading methods are simple & repeatable.

Combine ROC & ADX & you have a momentum hunter
Blend these two indicators with the correct parameters & Bob's your uncle. Both ROC & ADX are essentially momentum-based indicators that measure the velocity of price movements. The ROC is a momentum-based indicator. Combined the ROC with an ADX indicator & you have a perfect indicator for measuring momentum & trend strength. Also, I use the ADX as a directional indicator as well.

View attachment 149527

Skate.
Too much information for me!!

All I need is a couple or a few Buys and/or Sells this Month or this Quarter
In advance

All these past tables IMHO is full of Smoke and Mirrors and are meaningless to me

I invite / challenge anyone here in this thread/site with Automated Intelligent Trading experience to do a few simple exercises

Let's log say ~6-10-15 trades in a quarter and see how she goes

I know this will fall on Deaf Ears
But that is exactly my point
XYZ Yacht.GIF
Ban Voyage and Gods' Speed
 
Too much information for me!!

All I need is a couple or a few Buys and/or Sells this Month or this Quarter
In advance

@Captain_Chaza it's too much information because you don't understand
Also what you are asking I've done many times before, trading my strategies live, and submitting (posting) the buy & sell signals before they had been entered into the market. There have also been members of this forum who actually traded along with me. With the new government rules, it's no longer possible.

May I suggest, you do a search
I've traded multiple strategies live in real-time in this regard so others could follow along without smoke or mirrors. Also, the actual trade results & ongoing information has been listed week after week, on an ongoing basis.

Here are two hyperlinks to get you started
They are the "HappyCat Strategy", the strategy has been fully discussed.


Skate.
 
Crikey!
I am not interested in what happened in "The Cinderella Years"
By you or by anybody
From what I understand EVERYONE Won in those days

Proves Nothing!

I am only interested in the NEXT 3-6 month sea trials in real time

"I knew this will fall on Deaf Ears Again
But that is exactly my point"

I have had my say on A.I. Trading and let that be my last on this matter !
Except for
"I knew this will fall on Deaf Ears Again
But that is exactly my point"


XYZ Yacht.GIF
 
Crikey!
I am not interested in what happened in "The Cinderella Years"
By you or by anybody
From what I understand EVERYONE Won in those days

Proves Nothing!

I am only interested in the NEXT 3-6 month sea trials in real time

"I knew this will fall on Deaf Ears Again
But that is exactly my point"

I have had my say on A.I. Trading and let that be my last on this matter !
Except for
"I knew this will fall on Deaf Ears Again
But that is exactly my point"


View attachment 149560
I think you're misunderstanding.

Markets move because people have emotions that drive desire - the desire for gain, and the desire to avoid loss. These desires cause behaviours that are predictable (buying and selling). TA (or AI as you call it) works because of this predictability. People aren't 100% predictable, but they're predictable enough that you can find an edge to exploit.

You're interested in the next 3-6 months. IMO, the best way to know the future is to look at the past. Human nature has barely changed in the last 100 years, and it's humans who move the markets.

Trend following works because people feel safe when they're part of the crowd. The bigger the crowd, the more the SP appreciates. The more it appreciates, the safer holders feel about down days which means less selling,... which feeds more upwards momentum.

Mean reversion works because when strong trends occur, people tend to overreact, causing a 'spring back' effect. Greed-fear-greed-fear, over and again.

You're implying TA is junk, and it's not. It doesn't appeal to everyone, and it's not the only way to trade, but it is legit. Use whatever method you like.
 
Last edited:
Figuring out "when to stay out" of the market
This year has been a difficult trading year but if your strategy is selective knowing when to stay out & when to enter makes a difference. Being very selective in which positions to buy, those that have momentum & volume nearly always ensure that you will keep most of the bumps in profits. It's unavoidable that "exit confirmations" necessitate giving back some open profits but in saying this my trading methods are simple & repeatable.

Combine ROC & ADX & you have a momentum hunter
Blend these two indicators with the correct parameters & Bob's your uncle. Both ROC & ADX are essentially momentum-based indicators that measure the velocity of price movements. The ROC is a momentum-based indicator. Combined the ROC with an ADX indicator & you have a perfect indicator for measuring momentum & trend strength. Also, I use the ADX as a directional indicator as well.


Skate.


Possibly there is a fundamental misunderstanding with regard to Mr Skate's trading style.

Mr Skate is a 'Swing Trader', which is 1 step up from a 'day trader'.

Entries are CRITICALLY important as evidenced from the highlighted text. The exits are CRITICAL, which are simply the loss of the entry conditions. The bit in the middle is the expansion of volatility. When volatility expands, things move.

Bear markets have higher vol. than do bull markets. You can, if trading vol. make better money in a bear than a bull.

There was a comment from @DaveTrade: "both 'when to get in' and 'when to stay out', they are two sides of the same coin".

This is probably correct. There is either a vol. expansion or there is not. No vol. expansion you stay out. A vol. expansion, you enter. A vol. expansion trumps technical considerations, although, will often occur at technical points, as stated by many, due to psychological reasons.

Where confusion twixt the 2 may exist is:

Vol. expansions move differently to price (most of the time, there are some exceptions but beyond the scope atm). Price can continue to expand for a short period as vol. starts to collapse. These are the failed B/O trades at technical resistance points. This is the 'stay out' side of the coin, confused, often with the 'get in' based on price, rather than a vol. expansion.

jog on
duc
 
All I need is a couple or a few Buys and/or Sells this Month or this Quarter
In advance

All these past tables IMHO is full of Smoke and Mirrors and are meaningless to me

I invite / challenge anyone here in this thread/site with Automated Intelligent Trading experience to do a few simple exercises

Let's log say ~6-10-15 trades in a quarter and see how she goes

THIS IS AN EXERCISE (requested by the Captain)
In no way is this a signal service but an exercise in the highs & lows that can be experienced when trading systematically.

@Captain_Chaza, If you are okay, I'll take up your challenge but will only reveal the signals in advance for the first of the three strategies my "HighRoller Strategy". All my strategies take time to find the correct timing when to enter trades.

On the 1st of October 2022
I decided to trade three new strategies. Since then, it had taken 6 weeks for the first signals to appear so if it's okay I'll post the results as the "HighRoller Strategy" has already started & it's early days of this exercise.

(1) The HighRoller Strategy
(2) The Pirate Strategy
(3) The VWMA Strategy

This will not be a signal service
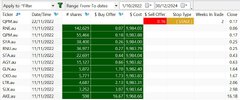
The first Buy signals from ("The HighRoller Strategy") appeared at the end of close Friday the 11th of November 2022. The Amibroker Exploration Analysis buy signals for my "HighRoller" Strategy is below. I've just done another scan minutes ago to give an updated analysis.

HighRoller.jpg


As of today
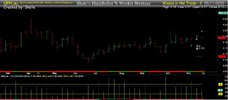
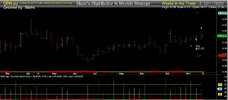
(QPM) has not performed as expected & it's currently a sell in the pre-auction Monday morning. Between now & the next Amibroker Exploration Analysis scan at the end of close on Friday the 25th of November that can change. But at the moment it's a sell.

Chart for (QPM)
Hang on, (QPM) is in profit, why the sell signals? Unfornaturely, the signal has already gone stale & has not performed as expected.

QPM.jpg


Second update at 12 noon today
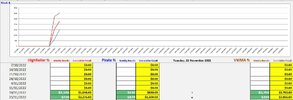
Today is week 8 of the three strategies but week two of trading.

Week 8.jpg


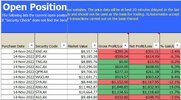
Open Positions
These are currently the "Open Positions" for the "HighRoller Strategy"

Open Positions.jpg


Updates
As I will be concentrating on the "HighRoller" strategy, reporting of the ongoing progress & signals will be displayed at the "end of trade" Fridays. There will be no "smokes & mirrors" with this exercise.

Skate.
 
Last edited:
Too much information for me!!

All I need is a couple or a few Buys and/or Sells this Month or this Quarter
In advance

@Captain_Chaza, at times I need to produce enough information so others can understand & follow along. It's better to explain my way of trading so when you see the information it's easily understood.

First off
There are only 3 pieces of software for me to trade systematically

#1. Norgate
Data supplier.

#2. Amibroker
Manages all my trading strategies. (Yes, Amibroker manages the open positions, stale stops/trailing stops & much, much more)

#3. Share Trade Tracker
Share Trade Tracker is my portfolio manager, keeping a record of all trades. Share Trade Tracker is also an analysis program to boot.

Chunking
If I post all the information at once, it will turn off readers, that's the reason I "chunk" my posts.

Skate.
 
I am only interested in the NEXT 3-6 month sea trials in real time

Nobody knows what the next 3 months will bring
This example of reporting "live" of one of my newer strategies ("The HighRoller Strategy") allows me the opportunity to explain how I trade using the three pieces of software posted above. (1) Norgate Updater supplies ASX "End Of Day" (EOD) data "delayed 20 minutes". (2) Amibroker requires data to produce up-to-date charts & reports. (3) Share Trade Tracker, does exactly as the name suggests "tracks all the information" to do with the purchase & reporting the movement of shares in & out of the portfolio.

Skate.
 
Of course, all trading carries risk, and there are a variety of factors driving market direction.

DISCLAIMER
The reporting of the "HighRoller" Strategy is for educational purposes & signals are theoretical & signals displayed shouldn't be misinterpreted as a signal service.

The "HighRoller Strategy"
This strategy has exactly 1,194 lines of code to produce three pieces of information for me to trade. It should also be noted of those 1,194 lines of code, there are 4 lines of code that produce the Buy & Sell signals. The rest of the code precisely defines parameters & settings, to produce the charts & reports.

At the end of the week when the market has closed
After 6 pm at the end of the trading week with the push of one button, Amibroker produces the "Exploration Analysis Report" that tells me 3 things in column order

Exploration Analysis Report Order
This analysis report is generated in the same order that I use to place an order in Commsec

(1) What ASX code to buy & sell
(2) How many shares to buy & sell
(3) What price to offer in the pre-auction.

Trading doesn't get any simpler
All orders from the "Exploration Analysis Report" are placed in the markets over the weekend waiting to snag the "opening price" on Monday.

Skate.
 
Too much information for me!!

Yes Captain I know, but these explanatory notes will help others follow along when I post my report on Fridays after the market closes.

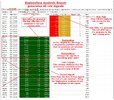
The Exploration Analysis Report ("1 recent bar(s)")
For actual trading I use the "Exploration Analysis Report", using the filter range set to "1 recent bar(s)" so only the current signals are displayed, whereas if you use the "From-To dates" it produces all the raw between those dates.

One Recent Bar Raw Signal.jpg


How to display all the raw signals ("From-To dates")
Using the "From-To dates" produces all the raw between the dates used for the report

From to Date - Produces all the raw signals.jpg

Skate.
 
Before I end this series of post
I trade using the "Exploration Analysis Report" a report where I can write code to filter the information in the order I require. Trading in the pre-auction the opening price is the "unknown part of trading" using this method. Using a (+3%) premium to the last closing price allows me to snag Monday's opening price 99.99% of the time "without" exceeding my budget for each position executed. No one wants to be caught short of having "egg on their face" of not having enough funds to cover the positions purchased.

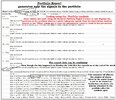
There are some who trade using the Portfolio Report
But it's not for me. Why? Because the original report displays one set of figures & another set of figures after the opening on Monday. Amibroker recalculates the report when the opening price is known,

Portfolio Report.jpg

.Skate.
 
Disclaimer (condensed)
"Past performance is no guarantee or reliable of future returns"

The hard work has been done
Disclaimers such as "Past performance is no guarantee or reliable of future returns" are in my opinion the hardest part of any Trading endeavour. System traders such as myself spend a tremendous time before one dollar is invested in a new strategy. You can take it from me, even though the "HighRoller Strategy" is a new strategy it's been through the wringer to make it this far. I'm just saying if I can't rely on past results to make decisions for the future what can I do?

Skate.
 
Small HighRollers_Diamond_Logo.jpg

"The HighRoller Strategy"
Portfolio Starting balance: $100k
Number of positions in the portfolio: 10
PositionSize: 10 X $10k equal positions
Starting Date: 14th November 2022
End Date: End of February 2023

Living up to expectations
No matter how smart we think we are, or how hard we work, we will regularly be hit by news, circumstances & developments that will be unforeseeable in the next three months. I'm sure during this 3-month exercise the "trading gods" will periodically use me for their entertainment & there is nothing I can do to prevent it. One thing for sure, I'll be mentally prepared knowing that drawdowns & losses are part of the trading process, so I'll take it on the chin & accept the outcome by being the ‘best loser’ I can possibly be.

This calendar trading year has been tough
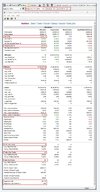
Below is the backtest report for "the HighRoller Strategy" for this calendar year from the 1st of January 2022 to noon today (23rd of November 2022). I'm sure if the "trading gods" look favourable on the markets for the next three months this strategy will hold its own. With unfavourable market conditions during the next three months, as with all trend-following strategies, this strategy will suffer.

HR TOP.jpg


Monthly Results.jpg

Skate.
 
Reports can be generated as desired
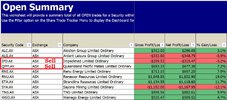
As of noon today the "Open Summary" & the "Exploration Analysis" of the "HighRoller Portfolio" are both listed. There are two positions earmarked for sale at the moment but that could all change in a heartbeat.

Amibroker Exploration Analysis current report
The analysis report displays all the raw signals, but there are only two that are in the "HighRoller Portfolio"

EAR 12noon 23rd Nov 2022.jpg


Share Trade Tracker
The "Open Summary of the HighRoller Strategy displays those two positions, earmarked for sale "at the moment". At the moment are the optimal words. One is currently a winner & the other is currently a bit behind. Rest assured, both positions have gone stale "at this point" in time.

HighRoller Open Summary.jpg


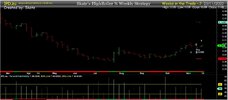
Current chart for (ASX:IPD)

IPD.jpg


Current chart for (ASX:QPM)

QPM.jpg


When will the avalanche of information stop?
About now. I wanted to display information on how I see trading so you can follow my thought process. Displaying the information goes a long way with my desire to help another trader, "trade profitably", which is the name of the game.

Skate.
 
Good afternoon Skate,

Hoping find you well. Been meaning to touch base much sooner regarding your posts re: Volume-Weighted Moving Average' (VWMA) and other matters. Also, had a chance to go through this thread, nearly 4 years of posts, some marvelous stuff documented, a credit to yourself and those that have contributed along the way. Awfully difficult to keep people happy all the time, as everybody has an opinion on things. It is the nature of our business. Yes, and a good thing too.

The concept of VWMA has been adopted as a trading benchmark embraced by rcw1 for many years. rcw1 applies this concept too swing and day trading methodologies, arduous, but yet rewarding in so many ways. rcw1, for mine, is a swing trader that likes to fast trade, daily and does not use any software other than charting and trading platform. 3 screens and a computer, for old times sake... Have built highways and over passes around /through VWMA so that it is more efficiently executed within scope of personal methodologies. rcw1 broadly defines this process/system as, 'numbers'. It goes well beyond the formula of VWMA. It's all about what is happening real time with depth of the stock and its volume at any point in time. Knowing the why's !! ... Demand v Supply, essentially. Contemporary times of 'computer invasion' of stocks, large shorting issues and super funds grabbing sh-t loads of shares, let alone the world economies and the Dow, makes things most interesting indeed, for the trader, the 'mosquitos' of the market. rcw1 will only target a handful of stocks at any one time so that maximum attention can be drawn in real time as to what they are doing... and trade accordingly.

When the price is above an open, it is up, conversely, when the price is below an open, it is down. No hidden agendas or rocket science here. But these are the start points. This is when the game starts and ends each day. Traders, mostly, look for reversals but can be impatient and 'trigger happy' thus buying when they shouldn't and holding / selling ultimately for a loss. Traders must limit this risk; it is a given. Again, no rocket science here. Traders also need to drink plenty of concrete to toughen up, to do battle again, after a few rounds in the 'trading ring' :)

Charts obviously play a major role, there are many available, an incredibly valuable resource/tool given the right circumstances. Charts are an excellent indicator, nothing more or for that matter nothing less. A chart cannot guarantee to the trader the stock will go up or go down, it simply provides data in a format for the eyes to easily read and interpret by the brain. Patterns and behaviours present, past and future ... perhaps. All traders will watch carefully for telltale triggers/signals, a mere slight trace of reversal could be enough.

Interestingly, may well pick up perceived different signals watching conjointly a one-minute chart and a 5-minute chart of the same stock movement. ha ha ha ha does one's head in... Also perceived different signals watching the live feed of sales of any particular stock as opposed to chart interpretation. There could well be a block of traders jump in at once, or out ... Who knows unless your on line watching. Then the questions are why?? What for?

rcw1 primary chart is the one-minute chart.
Other evidence-based concepts include, ADR equivalent analysis, TA, research of publications which may reveal valuable information to help make / forecast trading decisions and comments made within chat / community forums.

rcw1 at times performs his own 'numbers' calculations manually, particularly with the first 3 minutes of the trading day (happy to explain this better another time) and maintain 'numbers' records, on a case-by-case basis. As data comes in, it gets added and divided by total volume to that specific point in time in line with the 'numbers' formula. Benchmarking, but not always, time may well not allow to jump in or out, but aligned towards two trades a day, per stock, one off the low of the day and one off the high of the day. What will be the low and what will be the high??? Whatever the trader wants it to be, but it must support and be directly aimed at an earn transaction, profit. Trade what is before you, off the pitch. Could be any number of trades for any one stock, could be none too. Depends.

This is nothing new or for that matter original.

Traders often fail not knowing for sure where price is going; enter when it's not valid for fear of missing out (herd / sheep mentality); over size for the size of the a/c; get greedy and try for more profit outside trading scope. A profit is a profit. rcw1 considers only an accumulative effect of earn both with the sell transaction and then the earn compounded with other trades by the leap frogging immediately into other trading stocks with profit and capital, round and round and round we go.

rcw1 does not abide by rigid rules, as for mine, it can restrict one's own natural ability, however, want to be clear, that rules are in place to mitigate against risk. Rules are good. On the balance rcw1 is a big supporter an advocate of one's own natural ability and being able to work unimpeded or without undue restriction of trading process. Somewhat contradictory I know. The use of your own cultural traits, emotion and application of life's learnings, 'tricks of the trade' are for mine most important. They cannot be taught; they are acquired whilst 'on the tools' where loss and sorrow and 'bloodshed' have been experienced. Experiences, occurrences which all 'value add' towards decision making considerations of when to move on a stock or not!!

During the passage of time rcw1 has become more flexible in the methodologies applied, with emphasis on 'gut feeling' ; déjà vu; making some plays with the numbers presented. Sometimes there is a fine line between utter stupidity and a balanced patient approach to earn. Difficult to define, provide an evidence base for, but nevertheless, rcw1 will rely upon past experiences to trade.
For mine it takes decades to make for a complete trader and even still, there are gaps.

When things don't go well, rcw1 will change trading account, over to a separate and completely different account. 95% of the time is it borrowed cash (Trading Loan) which is used but when trades are not going well, will change over to savings account. Found that this quietened the enthusiasm... a new lease of life so to speak, like a 'smoko break', stemmies the tide... Marvelous how a simple thing like changing an account, steady's the ship.

Perfection is not when you have nothing more to add, but when you have nothing more to take away - Antoine De Saint Exupery.

Perfection requires 'absolute resolve and discipline' in real time. For mine, simplicity in a practical sense helps generate perfection. Perfection cannot be judged over a snapshot of time, it is infinite, it is required to be ongoing, open ended, as applied to the task at hand, in this case, trading. Perfection is a 'state of mind' what rcw1 strives to achieve and remain in 'that zone', when trading. To be perfect. Laugh you may, but that is rcw1 objective every single day that a trade takes place. Once gaining the requisite level of perfection, standard, confidence builds, it snowballs, the mind becomes overwhelmingly full of positive thoughts, clearer mind, clearer picture an enhancement of judgement duly follows.

Setbacks come and go all the time. Landslide setbacks, but traders need to pick oneself off the floor dust oneself off and get back onto the saddle, smarter and wiser, building on the other remarkable traders' trait, that of resilience. True traders run the market over decades. To survive, is a privilege.

rcw1 opinions. There is no script.

Be perfect and trade whatever system the trader is comfortable with. Together in the sandpit to earn, there can be no other motivation.

Have a very nice day, today.
edit: change to read good afternoon

Kind regards
rcw1
Sometimes you feel like dumping stuff & this thread might be the perfect place.

Helping Others
You might want to dump stuff here to help others

Unload
You might want to unload & dump something off your chest

Gems
You might even want to dump some gems here

Let it go
Sometimes you can't let somethings go till you dump it on paper

Dump it here
If you want to dump it, dump it here

Skate.
 
Top